Trading volume was muted ahead of the Fed announcement
Pending home sales were a bullish surprise this morning. According to stats, homes under contract for sale were up 1.4% in March. However, it was the crude oil inventory report that garnered the largest reaction...at least until traders remember it was an FOMC day, and stock prices reverted right back to where they started. The S&P fell markedly following a $1.00 drop in crude oil futures at the hands of the latest weekly inventory report, but both oil and the S&P recovered later in the day.
Naturally, the story of the day was the Fed. The Fed didn't change interest rate policy, as was widely expected. They also basically copy and pasted their policy statement from the last meeting. In short, today's FOMC meeting was a non-event.

Interest rates are low, but they are lower around the globe.
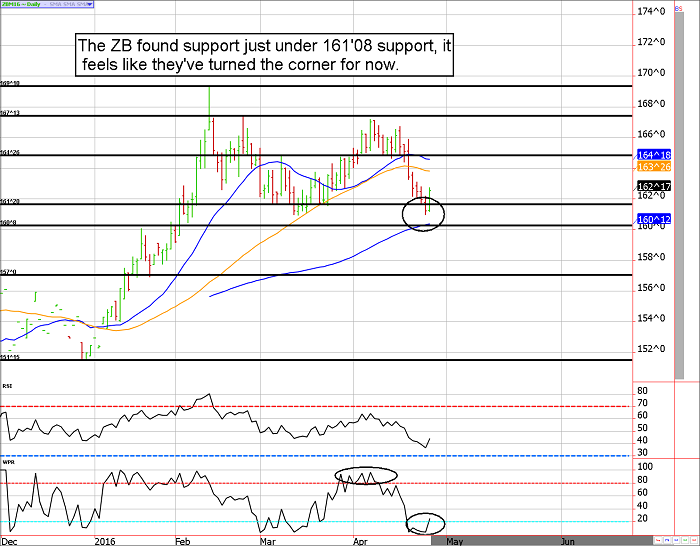
Fundamentally, it doesn't make sense for investment dollars seeking safety to purchase sovereign debt at zero, or even negative interest rates, when it is possible to purchase U.S. Treasuries with a higher credit rating and a better yield. For this reason, it is difficult to see Treasuries continue to fall out of favor.
Some of last week's selling was based on speculation that Saudi Arabia would be forced to dump U.S. Treasury holdings. However, we've since learned that the Saudi's are holding a fraction of the Treasury securities some of the more aggressive speculators were assuming. Further, although they are strapped for cash, oil is firming up and they likely don't need to liquidate any of them; and it doesn't seem they will be forced to liquidate (which was thought to be the case based on the proposed 9/11 Bill).
In our opinion, Treasuries have turned the corner and should make their way higher in the coming weeks.
Treasury Futures Market Analysis
**Bond Futures Market Consensus:** Stocks are overstretched on the upside, and Treasuries are oversold. The best trades might be from the long side of Treasuries.
**Technical Support:** ZB : 160'08, 156'25, and 153'26 ZN: 129'09, 128'22, and 128'00
**Technical Resistance:** ZB : 167'07, 168'08, and 169'14 ZN: 130'25, 131'10, 131'29, and 132'20

Is it time to Sell ES Futures in May and go away?
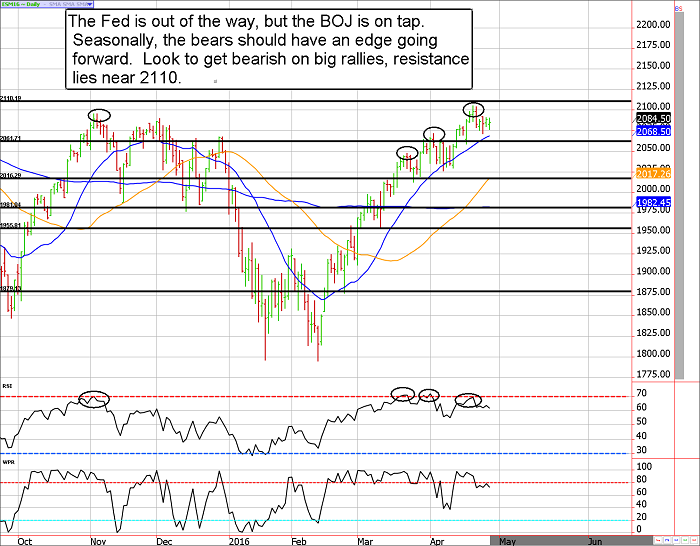
According to the Stock Trader's Almanac, the "best six months" for the stock market end with April. Further, the months of May and June were horrific between 1965 and 1984; as a result the mantra "Sell in May and walk away" is something we hear a lot of every year. To be honest, it probably works more than it doesn't, however, that doesn't mean selling on May 1st is easy money. For example, sometimes the equity market moves sharply higher most of May, to find a peak later in the month. Although that year would technically be a "success" in regards to the mantra, it doesn't necessarily translate into profits.
With that said, it hasn't paid to be bullish stock from May through November. Also offered by the Stock Trader's Almanac, a $10,000 investment (we assume they are referring to the S&P) compounded to $838,486 for November through April over 65 years, compared to a loss of $221 for May through October.
If historical tendency has anything to do with it, the best trades in the ES will likely be from the short side as we move into the summer months. After all, this election cycle could get pretty wild!
Stock Index Futures Market Ideas
**e-mini S&P Futures Market Consensus:** The ES feels like it is rolling over, if there is one last hurrah rally it will run into sharp resistance at 2110. Look to get bearish on sharp rallies!
**Technical Support:** 2059, 2016, and 1981
**Technical Resistance:** 2110, 2116, and 2135
e-mini S&P Futures Day Trading Ideas
**These are counter-trend entry ideas, the more distant the level the more reliable but the less likely to get filled**
ES Day Trade Sell Levels: 2092 (minor), 21010, and 2116
ES Day Trade Buy Levels: 2073, 2064, and 2053
In other commodity futures and options markets....
November 24 - Roll long December corn into March to avoid delivery.
January 14 - Sell March 10-year note 129.50 calls for about 19 ticks, or $300.
February 3 - Buy back the March 10-year note 129.50 call, and replace it with a 2 short April 132 calls and 1 short 128 put. This spreads the risk out on both sides of the market, and slows things down.
February 9 - Buy back the short ZN 128 put, replace it with 2 (double the quantity) of the 129 puts. This brings in more premium, and offers a better hedge to the upside risk.
February 11 - Roll ZN strangles higher to the 133.50/130.50 strikes to try to keep up with the rally and volatility.
February 17 - Buy back April ZN 133.50 calls to lock in a gain.
February 18 - Sell April ZN 131.50 calls for about 28 ticks to hedge the short 130.50 puts remaining from the original strangle.
March 2 - Buy back April ZN 131.50 calls near 8 ticks to lock in a gain.
March 3 - Sell April 130 calls for about 29 ticks to bring in more premium and hedge our short put position.
March 8 - Sell a May ZN 131 call for about 29 ticks. This brings our trade to only slightly bullish.
March 10 - Buy back the May ZN 131 call and all of the April 130 calls. This locks in profits on the call side of the trade, we'll hold the puts in hopes of a bounce.
March 14 - Sell May ZN 129 calls for about 40 ticks, to bring in more premium and hedge our downside risk.
March 17 - Buy back all April puts and May calls, then sell a fresh strangle using the May 130/128.50 strikes. This gets us into a more reasonable position which stands to profit from premium erosion (the previous trade was largely intrinsic value at the point of exit).
March 29 - Buy back May ZN puts to lock in a profit.
March 30 - Sell June ZN 128.50 puts to get back into strangles. This leaves the trade short May 130 calls, and June 128.50 puts...a short strangle with a slightly bearish stance.
March 30 - Sell June ES 2150 call near 10.00/11.00.
April 7 - Buy back ZN 128.50 puts near 9 to lock in a gain.
April 13 - Sell ZN 129.50 puts to bring in more premium and get back into strangles.
April 21 - Sell June Live Cattle 110 puts for about $400.
**There is substantial risk of loss in trading futures and options.** These recommendations are a solicitation for entering into derivatives transactions. All known news and events have already been factored into the price of the underlying derivatives discussed. From time to time persons affiliated with Zaner, or its associated companies, may have positions in recommended and other derivatives. Past performance is not indicative of future results. The information and data in this report were obtained from sources considered reliable. Their accuracy or completeness is not guaranteed. Any decision to purchase or sell as a result of the opinions expressed in this report will be the full responsibility of the person authorizing such transaction. Seasonal tendencies are a composite of some of the more consistent commodity futures seasonals that have occurred over the past 15 or more years. There are usually underlying, fundamental circumstances that occur annually that tend to cause the futures markets to react in similar directional manner during a certain calendar year. While seasonal trends may potentially impact supply and demand in certain commodities, seasonal aspects of supply and demand have been factored into futures & options market pricing. Even if a seasonal tendency occurs in the future, it may not result in a profitable transaction as fees and the timing of the entry and liquidation may impact on the results. No representation is being made that any account has in the past, or will in the future, achieve profits using these recommendations. No representation is being made that price patterns will recur in the future.
