There’s no other way to say it: gold had a bad week. Last Tuesday alone, the yellow metal fell more than 3 percent, shuffling off $43, in its biggest one-day loss in three years. It broke below the psychologically important $1,300 mark and touched the 200-day moving average before rising again Friday.
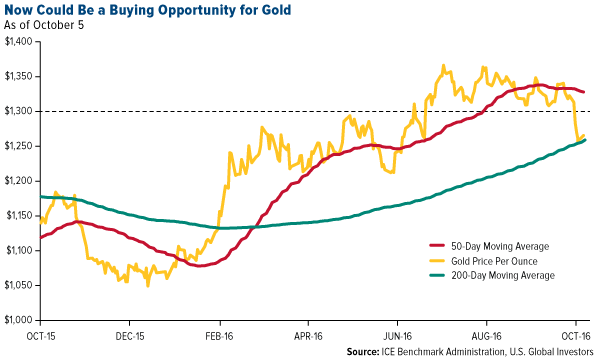
In the past, gold has surged in September and corrected in October leading up to Diwali, the Festival of Lights, in India. Consumers there are expected to take ample advantage of the gold discount’s timing, as it follows a strong monsoon season and comes just before Diwali and the wedding season, when gifts of gold are considered auspicious. The correction has been followed by a Christmas and Chinese New Year-driven rally.
The Love Trade in China was on hold last week, as markets in the world’s largest consumer of gold were closed in honor of Golden Week, when people celebrate the founding of the People’s Republic of China. The Asian giant has increasingly become a price-maker of gold—remember, it introduced a renminbi-denominated fix price in April—so when it’s not in the game, the shorts can easily bring the metal down. Many investors put in their trades the previous week, anticipating China’s closure.
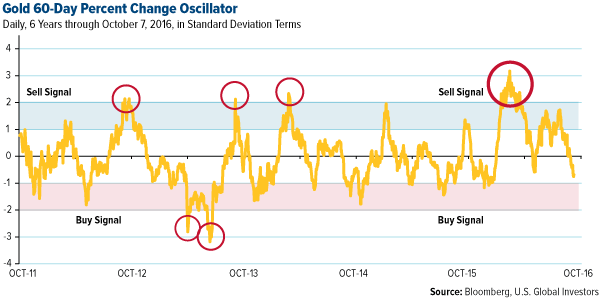
Below, you can see gold edging close to negative 1 standard deviation, triggering a “buy” signal.
{{|Goldman Sachs}} analysts, who normally hold a bearish outlook on the yellow metal, echoed the sentiment in a note last week, writing:
We would view a gold selloff substantially below $1,250 as a strategic buying opportunity, given substantial downside risks to global growth remain, and given that the market is likely to remain concerned about the ability of monetary policy to respond to any potential shocks to growth.
As always, I recommend a 10 percent weighting in gold, with 5 percent in bullion and coins, the other 5 percent in gold stocks. Investors might be interested in using this time to rebalance. With China open for business again this week, I expect the metal’s performance to improve.
Like gold, the British pound took a hard beating last week, plunging more than 6 percent in early Asian trading to a three decade-low against the U.S. dollar.
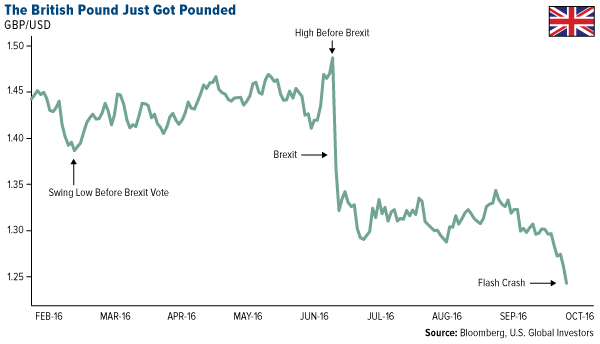
I don’t know about you, but I find it interesting that the drop occurred mere hours after French President François Hollande told an audience that the European Union should take a “firm” stance against the U.K. for its Brexit vote, partially with the intent of discouraging other EU nations from leaving the bloc.
The Debt Hangover
This week, the International Monetary Fund (IMF) released an eye-opening report on the ticking time bomb that is global debt, warning the nations of the world that if they don’t deleverage—and soon— there could be grave consequences. At the very least, we could continue to see sluggish growth.
In 2015, global debt of the nonfinancial sector, including governments, households and nonfinancial firms, stood at a mind-boggling $152 trillion, or 225 percent of world GDP, an all-time high.
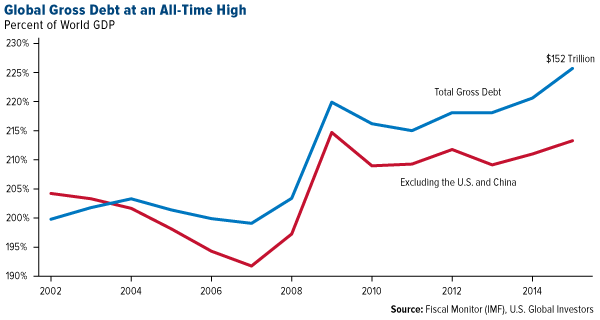
Two-thirds of this amount, according to the IMF, comes from the private sector, which has lately gorged on cheap credit, especially since rates were slashed following the recession. This not only raises the possibility of another financial crisis,
but can also hamper growth even in its absence, as highly indebted borrowers eventually decrease their consumption and investment.
In other words, debt plus slow growth leads to even more debt and even slower growth, creating a “vicious feedback loop” that becomes harder and harder to escape, the IMF writes.
$23,000 gold?
In June 2015, I shared with you a thought experiment of what might happen to the price of gold if tomorrow it backed global debt 100 percent. Since it’s been more than a year since then, and because a few things have changed, I thought it might be interesting to revisit this idea.
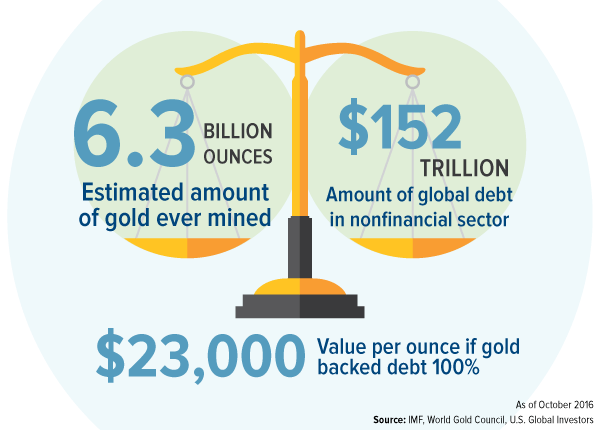
According to the latest data from the World Gold Council (WGC), an estimated 186,700 metric tons (6.5 billion ounces) of gold have been mined in the history of the world. Based on today’s prices, this mountain of metal is worth $8 trillion.
Let’s imagine we wake up tomorrow morning and learn that all debt—all $152 trillion—were backed by gold. That means each ounce of the stuff would suddenly be valued at roughly $23,000. With one American gold eagle, then, you could buy a new family sedan and still be left with some pocket change.
Now of course this is ridiculous, but that’s part of the experiment.
There was a time when most advanced nations’ currencies were backed by physical gold (and/or silver). And because gold is limited, so too was public spending. In 1970, a year before President Richard Nixon “closed the gold window,” the U.S. owed $370 billion. Today, it owes $19.5 trillion, or more than $163,000 per American taxpayer.
Had we stayed on something resembling a gold standard, it would have been highly unlikely, if not impossible, for our debts to climb so high.
I’m not saying we should—or even can—return to such a system, despite the endorsement of Donald Trump, Ted Cruz and several other prominent politicians. It would be challenging to find a single legitimate economist who supports a gold standard in today’s incredibly complex economic environment.
Central banks, on the other hand, continue to add to their gold reserves and drive demand.
According to a Macquarie report last week, banks added 27 tonnes to their reserves in August in an effort to diversify their assets and hedge against their own policies. As we’ve been seeing lately, Russia and China were responsible for a huge percentage of the buying, with Russia saying it has no specific target amount, according to the WGC.
In a survey of 19 central bank reserve managers, the WGC found that close to 90 percent of them have plans either to increase their gold reserves or maintain them at current levels.
Investors might consider doing the same, for the very same reasons.
Standard deviation is a measure of the dispersion of a set of data from its mean. The more spread apart the data, the higher the deviation. Standard deviation is also known as historical volatility.
Disclaimer: All opinions expressed and data provided are subject to change without notice. Some of these opinions may not be appropriate to every investor. By clicking the link(s) above, you will be directed to a third-party website(s). U.S. Global Investors does not endorse all information supplied by this/these website(s) and is not responsible for its/their content.
U.S. Global Investors, Inc. is an investment adviser registered with the Securities and Exchange Commission ("SEC"). This does not mean that we are sponsored, recommended, or approved by the SEC, or that our abilities or qualifications in any respect have been passed upon by the SEC or any officer of the SEC.
This commentary should not be considered a solicitation or offering of any investment product.
Certain materials in this commentary may contain dated information. The information provided was current at the time of publication.
