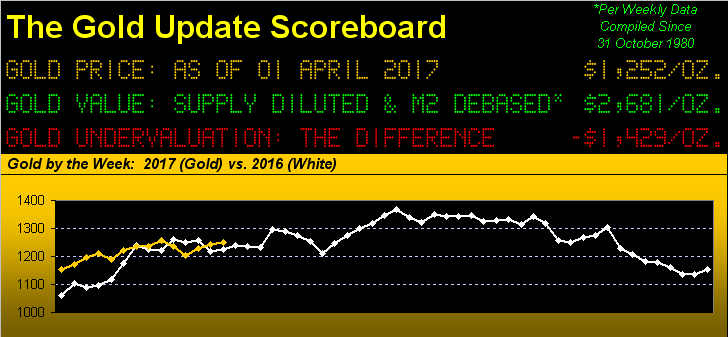
Silver is +14.5% year-to-date by settling yesterday (Friday), as well as the week, the month, and the quarter at 18.275. Pale in comparison is gold's performance, its settle at 1251.6 marking a +8.6% run to this point in 2017, albeit that was its entire net increase for 2016, (after en route having been +29.9% at Base Camp 1377).
So as we oft quip, "change is an illusion where as price is the truth", for in looking at the above panel, we find gold ahead of where 'twas a year ago by only 28 points (+2.3%). Yes, 'tis is better than that return on your savings account, but precious metals' prices persist as paltry. For as shown in the scoreboard, the yellow metal "ought be" at $2,681/oz. and in applying the average millennium-to-date gold/silver ratio of 62.3x the white metal "ought be" at $43/oz.
"And then there's the overshoot, right mmb?"
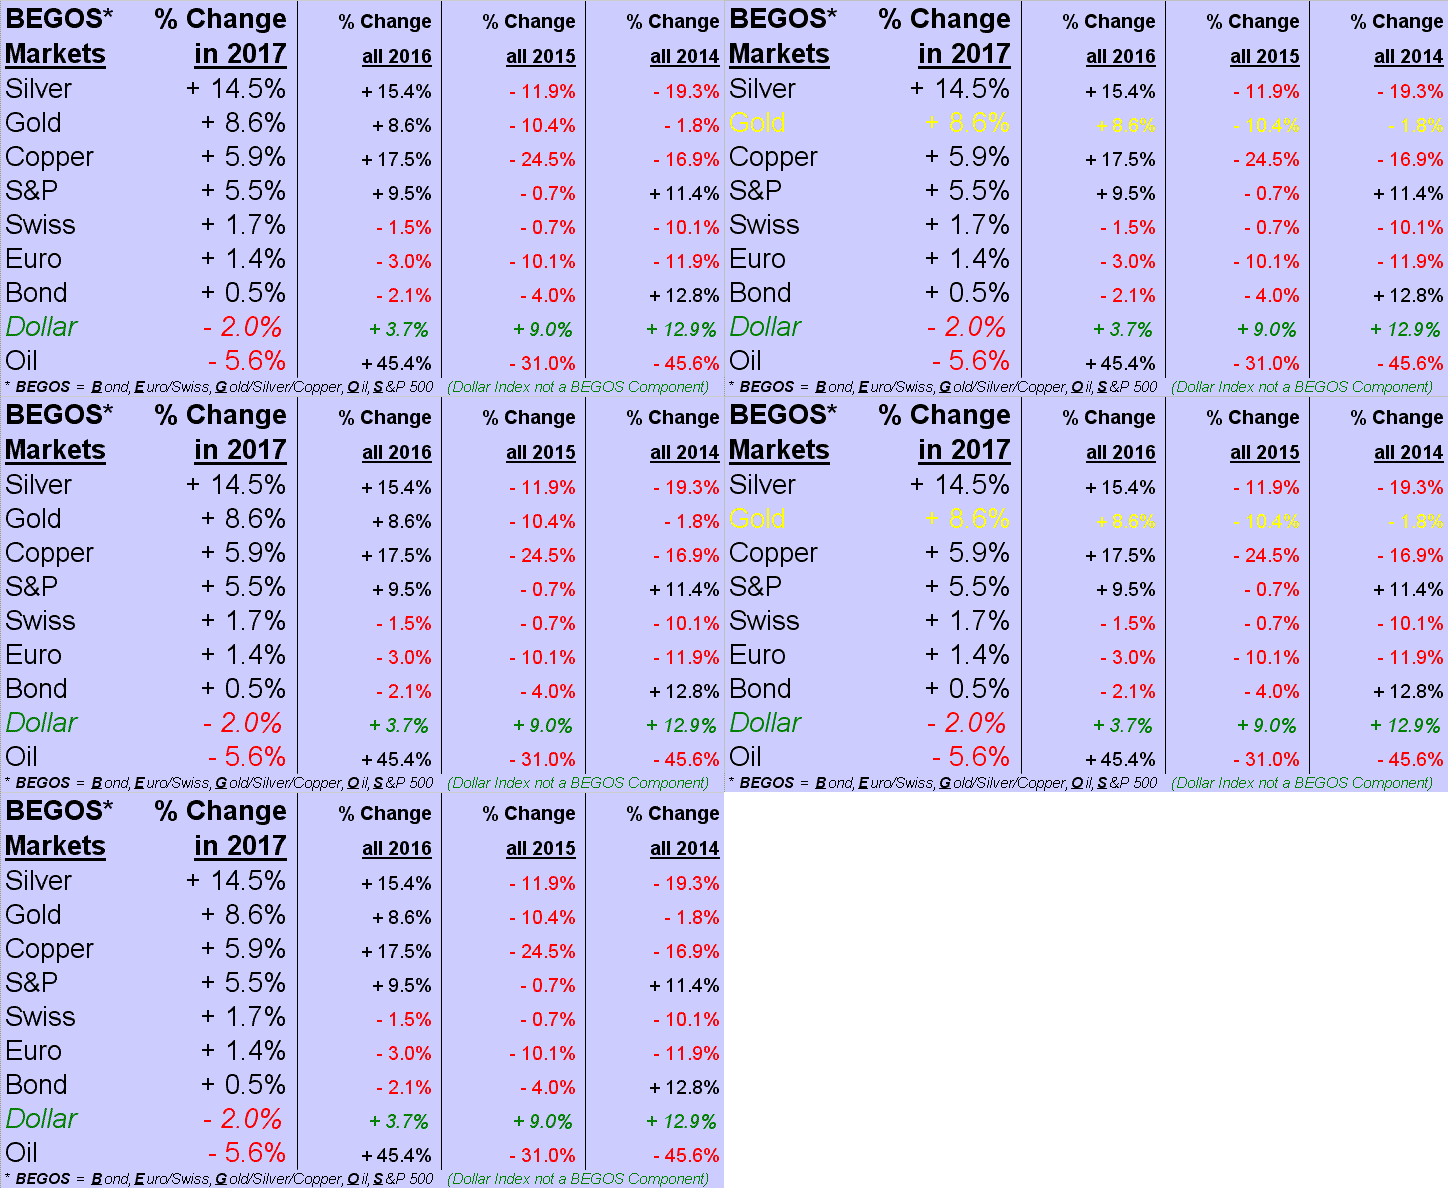
Right, Squire. So there's still time for you to plan that big party, for which payment can be made in entirety by owning the precious metals today rather than someday. Either way, in marking both March's and Q1's conclusion, here we go with the BEGOS Markets standings year-to-date. Of note, at this time a year ago, 'twas gold leading the pack (+15.4%) followed by silver (+8.9%); this year, they've swapped performance almost to perfection, at least to this point, for it remains to be seen if they'll again peter out come mid-year's point:
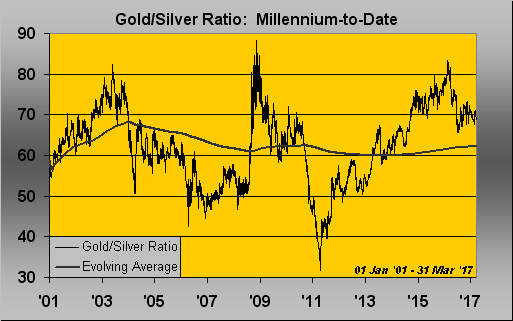
Having mentioned the ratio of gold's price to that of silver, here 'tis from 01 January 2001 through yesterday (31 March 2017). The ratio being relatively "high" in recent times vindicates silver's bulls, (or arguably gold's bears, although year-to-date suggests they're still in winter hibernation), hence a robust silver nation:
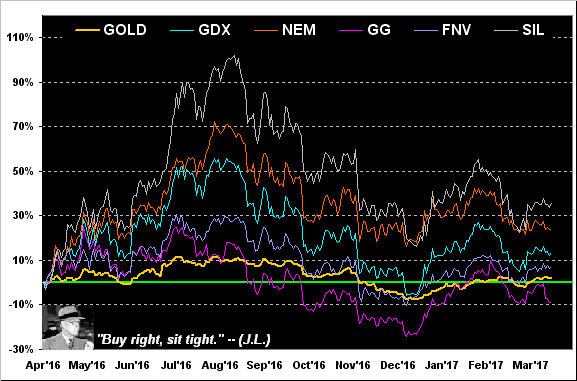
Indeed as we go to our year-over-year view of gold itself (+2%) vis-à-vis the key precious metals equities, 'tis SIL (the popular exchange-traded fund of the silver miners) leading the pack +36%, followed by NEM (Newmont Mining (NYSE:NEM)) +24%, GDX (NYSE:GDX) (the prominent exchange-traded fund of the gold miners) +13%, Franco-Nevada Corporation (NYSE:FNV) +7%, and managerially-maneuvering Goldcorp Inc (NYSE:GG) actually -9%. A core reader wrote in suggesting that the miners' leverage may have gotten a bit ahead of itself last year (upwards of 6x) over the price of gold, justifying less accelerative "umph" this year. The chart bears that out, but do not be without:
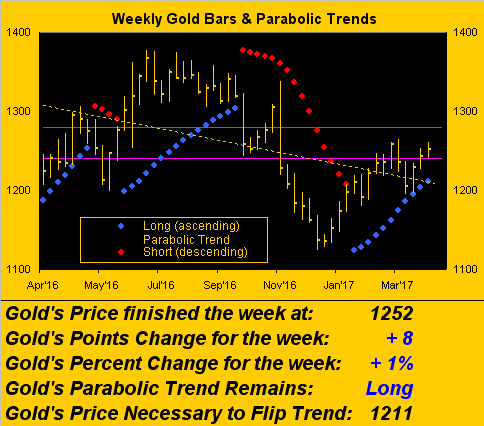
As we next turn to gold's weekly bars, price remains (per last week's missive) rattlin' 'round in the purple-bounded 1240-1280 resistance zone. Also, as the leftmost (oldest) data drops off the chart week-by-week, the dashed linear regression downtrend line has been somewhat steepening. Still, measuring from the present price (1252) to the rightmost Parabolic blue dot (1211) leaves 41 points of room for price to wiggle about in the ensuing week without flipping the trend to Short; (gold's "expected weekly trading range" is presently 33 points).
That said, (per the website's Prescient Commentary), gold's technical study of the 12-hr. MACD ("moving average convergence divergence") negatively crossed on Thursday, giving us a Market Rhythm Target of 1232, (prior to the next positive crossing of that MACD). Were such to will out and the next Parabolic blue dot reach up to around 1220, this Long trend shall have all but run out of puff:
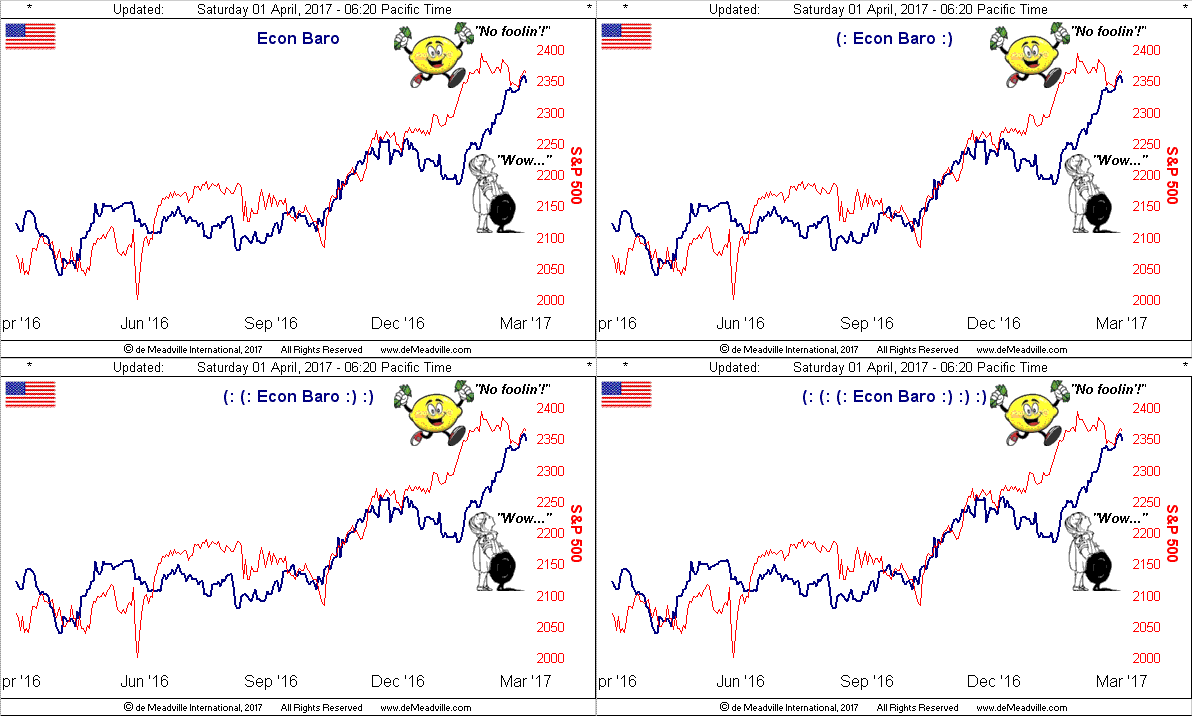
Economically, the Barometer continues to impress, the only weak chink in the incoming data this past week being a softening in the growth of Personal Spending (from +0.2% in January to +0.1% in February). But March's Consumer Confidence reading of 125.6 was its best level since November 1998's 126.4. The highest Consumer Confidence level in our data-bank was 144.7 reached twice during 2000 (in January and May) from which followed the "dot-com" bomb. Here's the present Baro from a year ago-to-date, as usual with the S&P 500 in red:
Or perhaps, we should less stress the word "impress", for in a newly-issued report from the Congressional Budget Office, the current 77% percent of federal debt held by the public is expected to expand, should today's spending and tax laws remain as they are, to 150% over the next 30 years. Moreover, the CBO says such debt growth would increase the likelihood of a fiscal crisis. (Now, perhaps I'm the last person to figure this out, but aren't we all ready in one? Got gold? Got silver?)
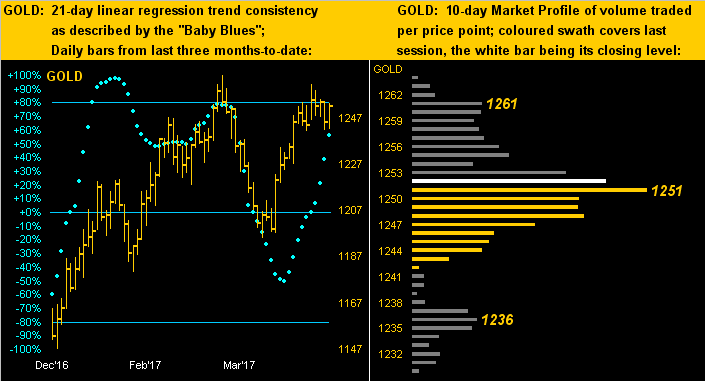
Speaking of which, let's drill down into the near-term states of the precious metals, beginning with this two-panel chart for gold. On the left across three months of gold's daily bars we see the recent recovery in both price and the baby blue dots that depict the day-by-day consistency of the 21-day linear regression trend; but there is the rather ominous presence of price's now forming a "double-top"; recall as well per the weekly bars, price is still stuck in resistance and the Parabolic trend is, if you will, getting "Long in the tooth". On the right in gold's 10-Market Profile, clearly the bulk of the trading volume over the last fortnight has gone off at the 1251 level; and from our Market Magnets page, 1250 is the volume-weighted average price traded across the entire Profile. 'Tis quite the near-term line in the sand:
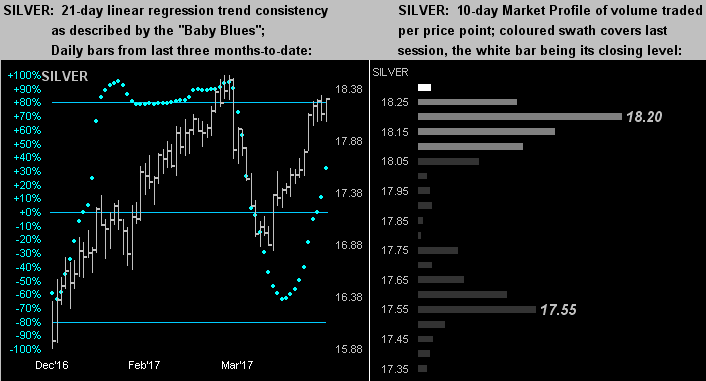
Here are the same two panel descriptions for Sister silver: at left in her daily bars is the early appearance of a "lower-high"; at right we again find her presently at the top of her Profile, but there is quite the dearth of contract volume traded down the chasm from 18.20 to 17.55 and you know how market's have that tendency to "fill the gap":
Therefore near-term, things could be couched as a bit gamey for the precious metals. That said, and with respect to the earlier analysis that precious metal prices "ought be" more than double their present levels, here's our broad-term look at gold's structure and upside milestones which continue to lie in wait, no foolin':
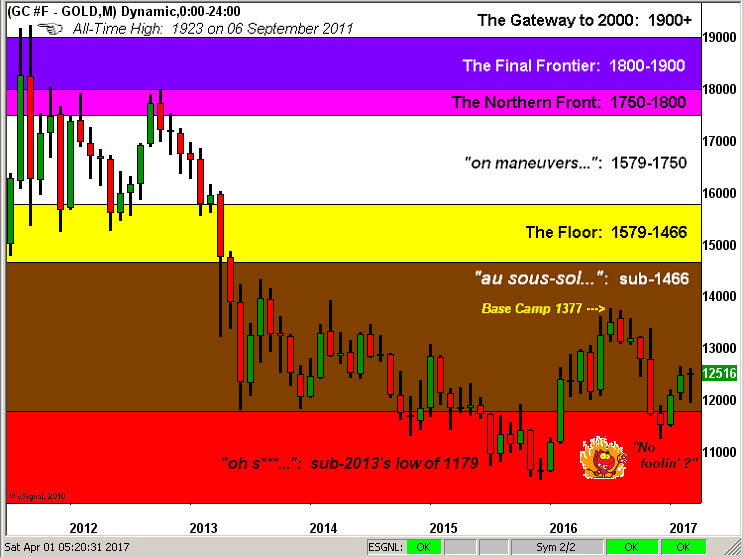
So: ahead of a hefty week of incoming EconData for the EconBaro, we've these brief across-the-pond notes of which to keep abreast:
■ "Brexit" was initiated this past week in rather ceremonious style, Prime Minister May invoking for the first time the European Union's "Article 50" via a hand-delivered letter through the bustles of Brussels to the EU, in turn kicking off a two-year slog over negotiating the this(s) and that(s). In the midst of it all, we understand that our British friends may be more preoccupied with getting that new 12-sided £1 coin to work properly in the parking meters and rail stations.
■ We shan't overlook that coming right 'round the bend like a TGV is Round UN of France's presidential election on 23 April, followed by a runoff between the final two candidates (neither for whom over 50% of the nation shall have initially voted) on 07 May in Round DEUX and then comes "Frexit"? Sounds like the EU could really have its hands full.
■ April has arrived and you know what that means: yes, the start of the European Central Bank's reduction in monthly debt purchases from €80 billion to €60 billion. Still, a slowing of inflation in both Spain and Germany is now weighing on the euro itself, and in turn, diminishing thoughts of the ECB perhaps nicking up rates late in the year. Still, the "morale" amongst German businesses was just reported at near a six-year high.
■ And whilst not exactly "Germexit", exiting this past Monday from Berlin's Bode Museum was a Canadian "Big Maple Leaf" 24-carat 100kg gold coin. Given its being 99.999 pure gold, in rounding down price's settle by a buck to $1,250/oz., that values to $1,250/oz. x 35oz./kg x 100kg = $4.3 million, roughly on par with the amount of loot stolen last Saturday from the Cartier in Monte-Carlo. 'Course, given that Monaco can seal off its 486-acre country in two minutes, they got the bad guys and recovered the stash. But for the as-yet-unsolved Berlin caper, there's no doubt about it: somebody's got gold! No foolin'!