As we have been discussing for months, both the Australian and the New Zealand economy are heavily dependent on the Chinese economy. Not to sound like a broken record, but China is a large importer of goods and services from both Australia and New Zealand. So, if China’s economy slows, demand for goods and services will slow as well. We first began discussing this issue in the Fall of 2019, as the U.S.-China Phase One negotiation was in full force. Once Phase One was agreed and finally signed on January 15, news began to spread of the Coronavirus. Just as traders thought these two economies were out of the woods, these new fears developed for both Aussie and Kiwi traders.
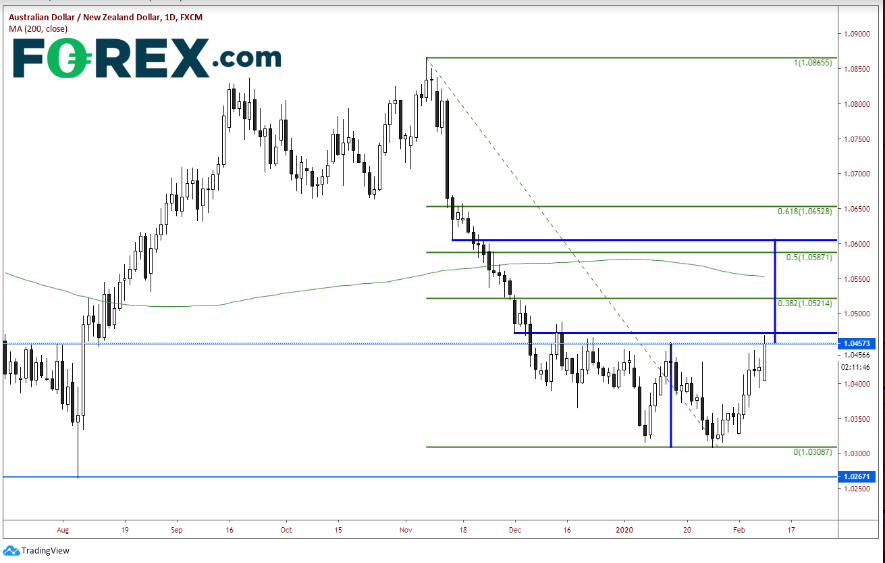
On November 7, 2019, AUD/NZD put in a high at 1.0865 and traded down to a low of 1.0361 on January 7. Price bounced, then tested that low once again on January 24. Again, price bounced. After putting in indecision candles on Thursday and Friday, price gapped open lower on Monday and began to trade higher, forming a large bullish candle. In doing so, price broke through the most recent highs at 1.0459, therefore forming the neckline of a double bottom price formation. The target for a Double Bottom is the distance from the bottom to the top of the formation, added to the breakout point. This would put the target just about 1.0600. To get there, though, price would have to break through immediate horizontal resistance at 1.0472 and the 200-day moving average at 1.0553. In addition, price would need to break both the 38.2% Fibonacci retracement and the 50% retracement levels from the highs on November 7 to the lows on January 7 at 1.0521 and 1.0587, respectively. Don’t be surprised if price doesn’t move in a straight line to target.

Source: Tradingview, FOREX.com
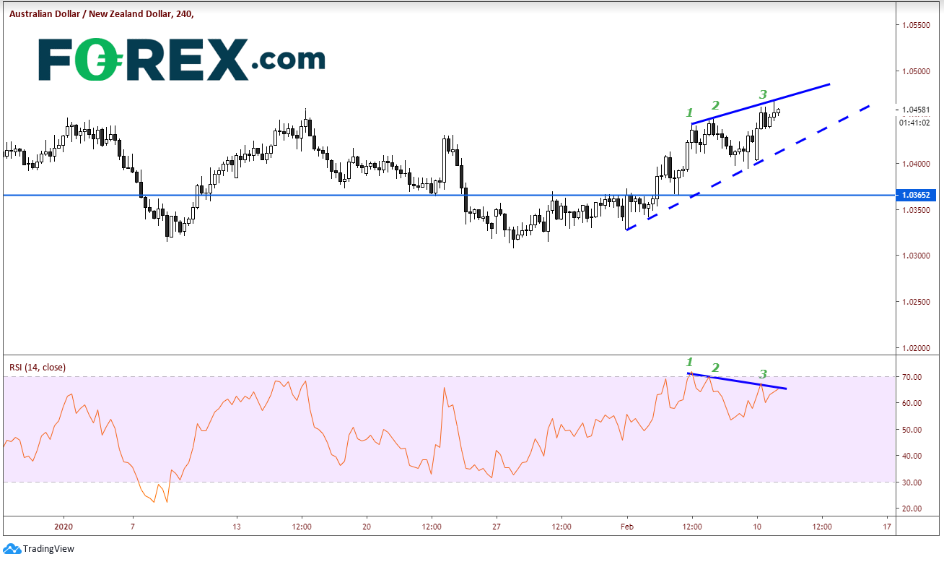
On a 240-minute timeframe, price and RSI are diverging on a rising wedge pattern. When price puts in 3 new highs in a row and the RSI puts 3 lower highs in a row, this is often referred to as a 3-drive pattern (taught to me by Dale Pinkert). This is a high probability pattern, which indicates that price may turn lower soon. (This is another reason price may not run to the target of the double bottom pattern in a straight line). If price does pullback, support is at the bottom trendline of the rising wedge near 1.0400, horizontal support near 1.0365 and the target for the rising wedge pattern near 1.0325.

Source: Tradingview, FOREX.com
The RBA held interest rates steady at 0.75% at their meeting last week, citing strong employment and housing. They bought themselves time to see how the coronavirus plays out. However, they did say that they may cut rates some time in Q2. The RBNZ meets Wednesday. Although expectations were for a cut to 0.75% from 1% at their last meeting on November 13, they left rates unchanged. Expectations for this meeting are for the RBNZ to leave rates unchanged at 1%. It will be interesting to see how the board members choose to deal with a possible China slowdown due to the coronavirus. Can they buy time, as the RBA did? Their next Interest rate decision meeting is March 25.
