Inflation in New Zealand rose 0.20% on an annual basis in the third quarter. It was lower than Q2's 0.40% increase but higher than economists' expectation of an unchanged print. Inflation edged slightly higher on housing related prices which were partly offset by declining prices in transportation. The better than expected inflation data managed to push the Kiwi higher with NZD/USD seen making strong gains for the second day.Looking ahead, US inflation figures will be coming out today as economists’ expect to see consumer prices rise 0.30% on the headline and 0.20% on the core. In the UK, inflation data is also coming up with forecasts of a 0.90% increase on the headline.
AUD/NZD Daily Analysis


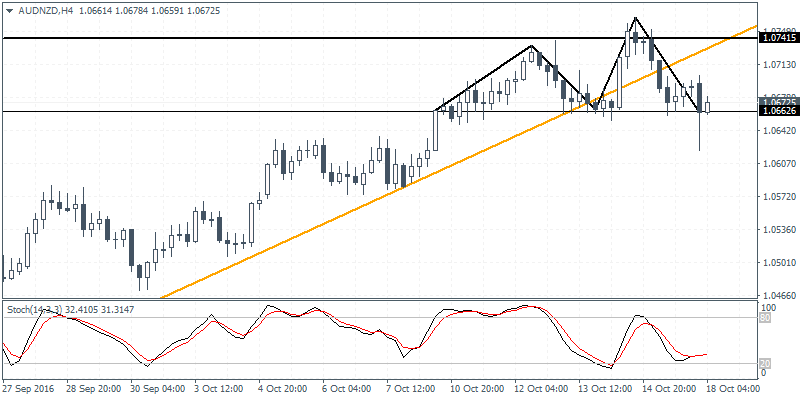
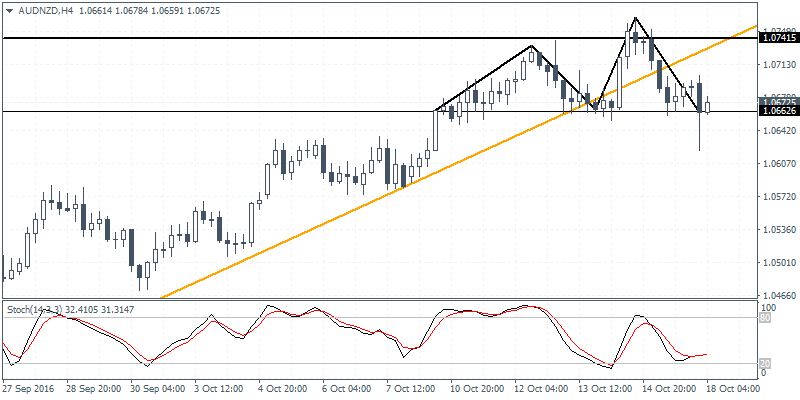
AUD/NZD (1.0672):The Aussie is seen giving up its gains after the rally since early September pushing prices towards late July highs near 1.0741 before reversing yesterday. Prices consolidated to form an inside bar yesterday with price action looking weaker to the downside. On the 4-hour chart, we see a strong bearish divergence leading up to the reversal near 1.0741. AUD/NZD broke down from the rising trend line and is currently looking to seek support near 1.0662. A near-term bounce could see AUDNZD retrace towards the breakout level, but further gains can be seen coming only on a break above 1.0741. The bias, therefore, is towards the downside with further declines seen coming on a break down below the current support at 1.0662. Also, watch for a potential head and shoulders pattern on the 4-hour chart as price attempts to form the right shoulder reversal.
GBP/USD Daily Analysis

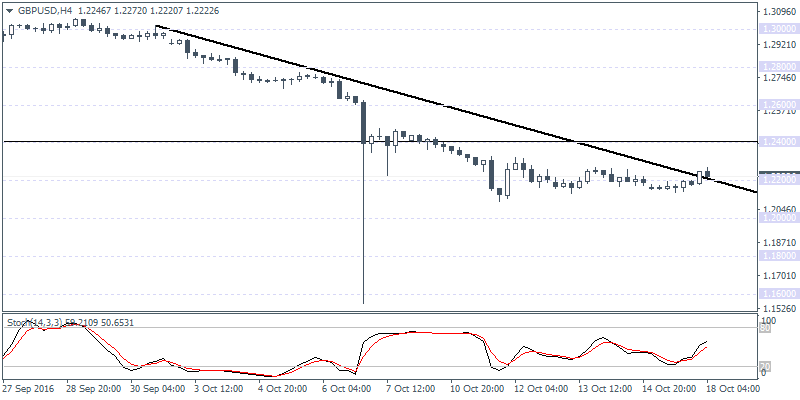
GBP/USD (1.2222):The British pound is currently showing signs of a potential reversal off the 1.2200 handle, but further confirmation is required. A daily bullish close above Friday's high of 1.2262 is needed to confirm the upside bias. On the 4-hour chart, theprice is seen breaking out from the falling trend line currently and could see the upside towards 1.2400 to establish resistance. This level had previously acted as support especially after the 7th October flash crash which sent the GBP lower. To the downside, failure to maintain gains above 1.2200 could see GBP/USD remains range bound with the lower target towards 1.2000.
USD/JPY Daily Analysis

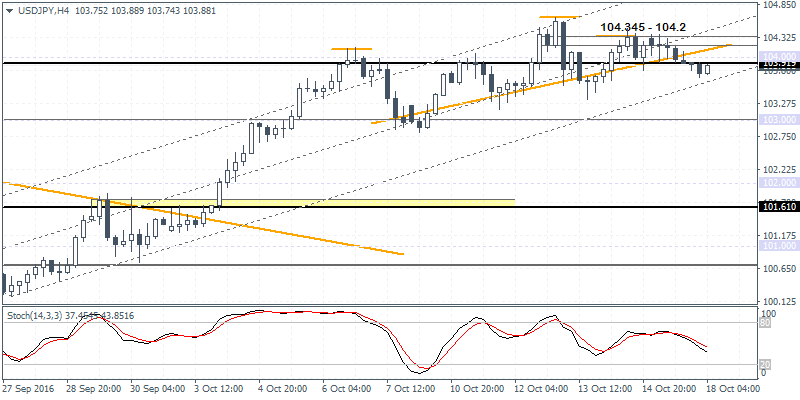
USD/JPY (103.88):Price action remains trading within last Thursday's range with two days of inside bar taking shape. This could signal a potential strong breakout in the near term with the bias to the downside as prices have failed to show any bullish signs near the current 104.00 resistance level. Furthermore, a retest towards 102.00 remains yet to be challenged for support. On the 4-hour chart, prices are seen trading near 103.91 minor resistance level with the head and shoulders pattern being validated near the 104.34 - 104.20 where the right shoulder was formed. We could, therefore, expect further downside towards 103.00 initially followed by 102.00.
