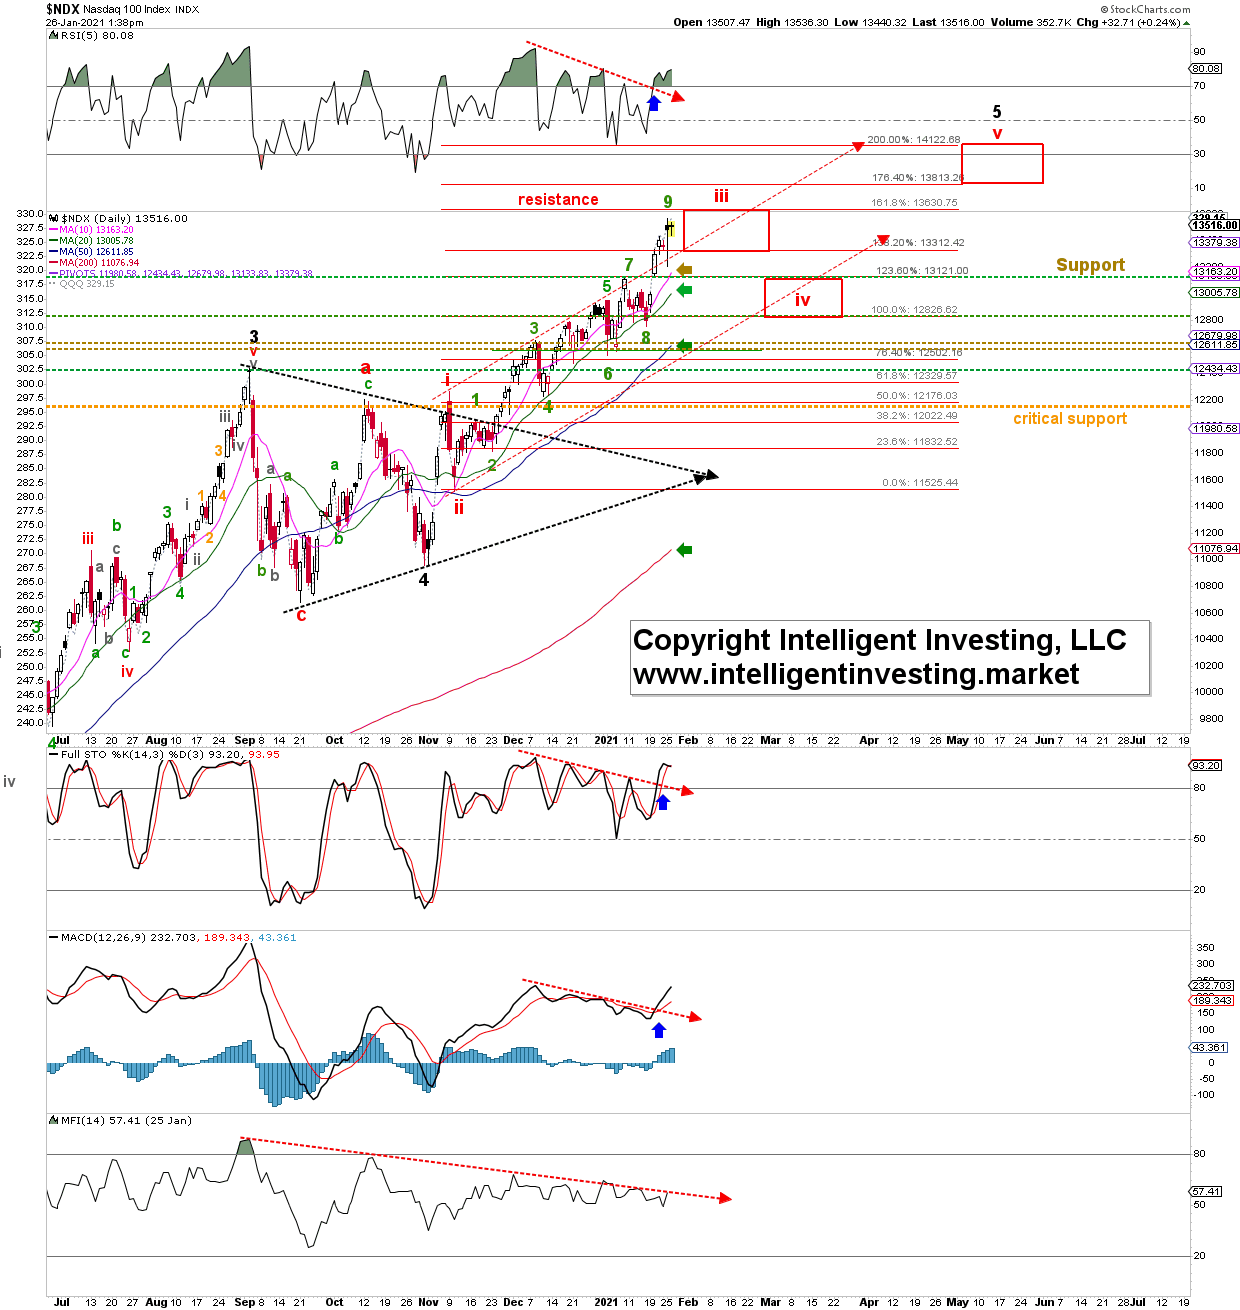
It has been more than six weeks since I last wrote an update on the Nasdaq 100. Back then, as the NDX was trading at the mid-12000s, I was looking higher towards 13100-13610 based on my detailed Elliott Wave Principle (EWP) count and technical analyses combined, using the following criteria:
“1) hold 12150 on a closing basis, 2) overcome resistance at the 10-day SMA, and 3) move price above the horizontal resistance zone of 12440-12500. Those are the three triggers to tell us wave-5 of wave-iii is under way.”
The path higher has been overlapping, i.e., with several more daily twists and turns than foreseen as one cannot know every move the market will make beforehand. The index did all the above and is now trading at 13500+. The green numbers 1 through 9 show the waves since Nov. 10, quantified at least two down days before making new highs. Thus, the foresight in December last year, based on objective analyses, was correct, but it also means short-term upside potential may become small (100p à 13610), versus downside risk (400-700p).
Figure 1. NDX100 daily candlestick chart with EWP count and technical indicators:

As the index moves towards the ideal (red) intermediate-wave-iii Fibonacci-extension of 161.80% X wave-i, measured from the wave-ii low in early November, it is time again to start to watch the price action more carefully. Price can always extend, and the chart is, per most of the technical indicators, and the price-to-simple-moving-averages setup, still 100% bullish. No one ever went broke from being cautious.
Why is the chart 100% bullish?
1) Price is above its rising 10d SMA, which is above its rising 20d SMA, which, in turn, is above its rising 50d SMA, which is also above its rising 200d SMA (green arrows);
2) the RSI5, FSTO, and MACD technical indicators are all on a buy (blue up arrows). Only money flow is lagging, which is a concern as liquidity drives markets, and currently, there is a clear downtrend in the MF14: less money is flowing into the index.
Bottom line: Barring any unforeseeable wave extensions, I anticipate (red) intermediate-iii to complete soon, followed by a wave-iv back down to ideally 12825+/-25 before wave-v to new all-time highs (ideally 13810-14120) kicks in. This wave-pattern would fit with 1) the average seasonality of the S&P 500 after U.S. Presidential inaugurations (see here), 2) the average seasonality of the Dow Jones for post-election years (see here), 3) and the 2009-2010 analogy (see here).
