Get 40% Off
👀 👁 🧿 All eyes on Biogen, up +4,56% after posting earnings. Our AI picked it in March 2024.
Which stocks will surge next?
Unlock AI-picked Stocks

NDX View: Large Cap Tech Breakout Ahead

Published 09/25/2016, 12:39 AM
Updated 07/09/2023, 06:31 AM

Below is a daily chart which shows the Nasdaq 100, the large cap tech stock index trading at a new all time high on Thursday.
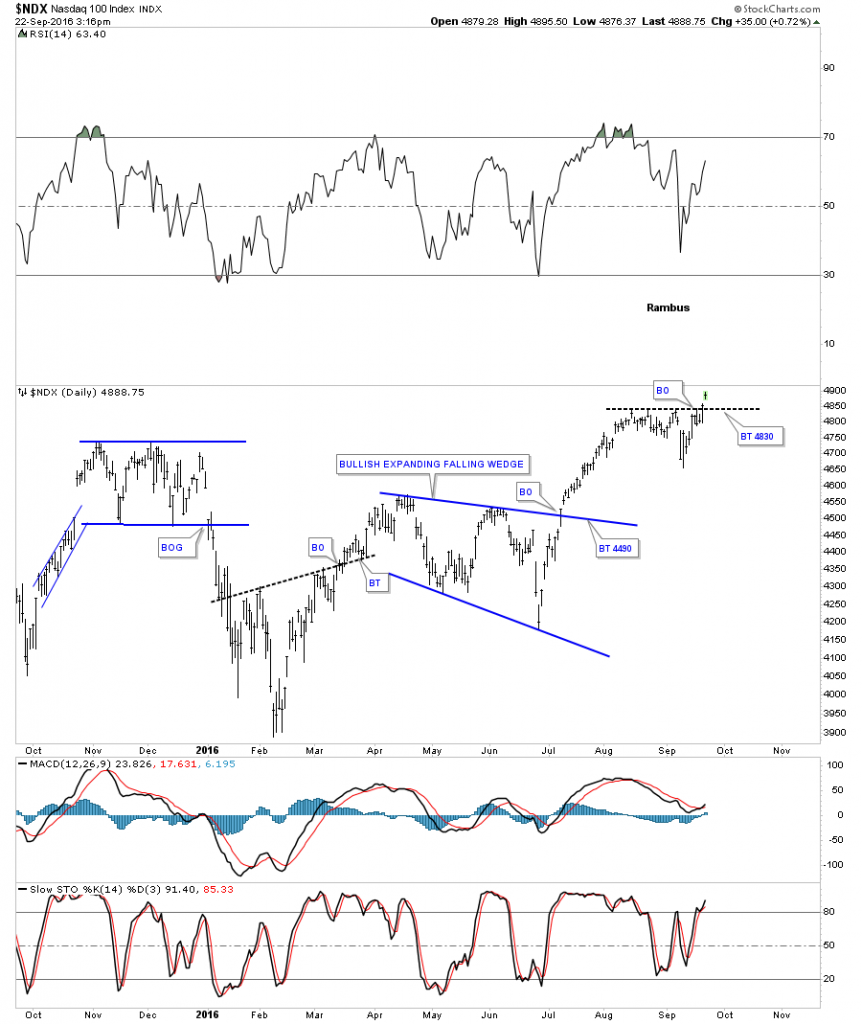
NDX Daily

Here's what the breakout looked like on the monthly chart:
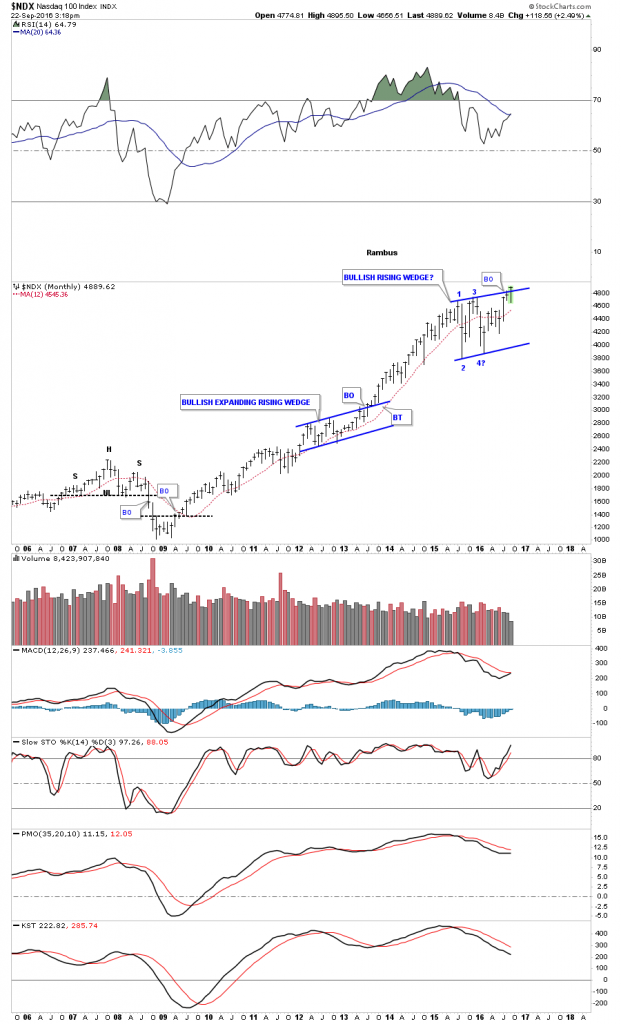
NDX Monthly 2005-2016

Before I discovered the junior PM stocks in 2002, the large cap tech stocks was where I played, especially during the 1990’s. The real move for the tech stocks actually began in 1995 whereas the final parabolic move started into the 2000 top.

You can see the red bullish rising flag that gave me a very good clue to look for a top at a minimum, or some type of consolidation pattern to start to building out. Things were extremely bullish back then, but to be looking for a top was off most investors' radar screens at that time. Luckily for me I got out close to the March high as suggested by the red bullish rising flag halfway pattern, measured by the blue arrows.

Once the price action broke below the horizontal black dashed line, that marked the beginning of the bear market that would wipe out most investors that hadn't sold because they were waiting for yet higher prices. That bear market also devastated many of the high flyer stocks, which never came back.

The NDX built out that red bearish rising wedge during its bull market run which ended in 2007 along with all the other stock markets. What was interesting in the crash that followed was the NDX made a higher low vs its 2002 bear market low, whereas many of the other stock markets made a lower low. This means it was showing relative strength.

3rd party Ad. Not an offer or recommendation by Investing.com. See disclosure here or remove ads .

That 2009 low ended up being the head of a very large symmetrical H&S bottom. The bull market that started in 2009 has run unabated for over seven years now and it looks like it’s getting ready for the next impulse move higher, now trading at new all-time highs. Most see a huge top, but I see a consolidation pattern that is breaking out topside. Remember, patterns that slope up into the direction of the main trend instead of against it, show strength. Note the previous red bullish rising flag that formed in the uptrend.

During this latest consolidation period note how low the RSI has fallen, back to almost the 50 area, while the price action is making new all-time highs. In my opinion, the energy is there for this large cap tech stock index to begin its next impulse move higher.
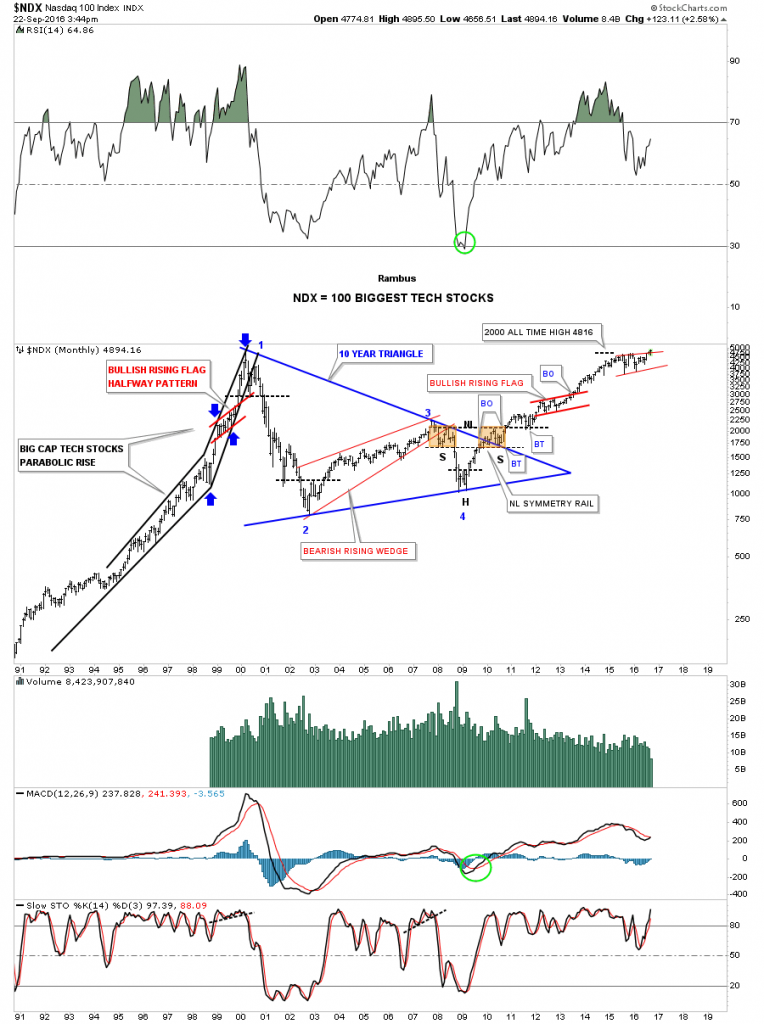
NDX Monthly 2001-2016

Latest comments

Risk Disclosure: Trading in financial instruments and/or cryptocurrencies involves high risks including the risk of losing some, or all, of your investment amount, and may not be suitable for all investors. Prices of cryptocurrencies are extremely volatile and may be affected by external factors such as financial, regulatory or political events. Trading on margin increases the financial risks.
Before deciding to trade in financial instrument or cryptocurrencies you should be fully informed of the risks and costs associated with trading the financial markets, carefully consider your investment objectives, level of experience, and risk appetite, and seek professional advice where needed.
Fusion Media would like to remind you that the data contained in this website is not necessarily real-time nor accurate. The data and prices on the website are not necessarily provided by any market or exchange, but may be provided by market makers, and so prices may not be accurate and may differ from the actual price at any given market, meaning prices are indicative and not appropriate for trading purposes. Fusion Media and any provider of the data contained in this website will not accept liability for any loss or damage as a result of your trading, or your reliance on the information contained within this website.
It is prohibited to use, store, reproduce, display, modify, transmit or distribute the data contained in this website without the explicit prior written permission of Fusion Media and/or the data provider. All intellectual property rights are reserved by the providers and/or the exchange providing the data contained in this website.
Fusion Media may be compensated by the advertisers that appear on the website, based on your interaction with the advertisements or advertisers.
© 2007-2024 - Fusion Media Limited. All Rights Reserved.