On March 3rd, when the natural gas price was around $2.84, I wrote that our indicators all pointed to upside in the price albeit with substantial volatility. At the time of this writing, the price is $2.87 but our most reliable fair value indicator no longer supports short-term upside.
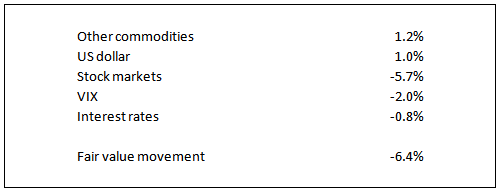
Last week saw a 5% bounce in the spot price, a move well at variance with a decline in fair value of 6.4%. The fair value is assessed using a multiple regression analysis of the natural gas price on 22 driver variables including interest rates, stock indices, other commodities and exchange rates. The database is six years of daily prices.
The contribution of each driver variable to the decrease in natural gas’ fair value last week is shown in the table below:

A price increase alongside a fair value decrease would normally be a signal to sell or go short natural gas.Taking positions in natural gas based on disparities between price and fair value change over the last 90 days would have yielded an annualized gain of 138% with volatility of 77%. This is the indicator that has changed direction recently.
Our assessment of natural gas’ fair value using the multiple regression model lies well above the current price, suggesting that the commodity is undervalued on fundamentals. However taking positions in natural gas based on this signal of under/over valuation would have generated negative returns over the last 90 days – hence we are inclined to use caution when relying on this indicator.
Our signal based on the lead given by the change in the Baltic Dry Index (BDI) of raw material shipping freight rates continues to support upside. Based on the relationship between the BDI and natural gas price over the last six years and the 6% rise in the BDI over the last month, a short term increase in the natural gas price is suggested by this indicator.
Trading this signal would have yielded a 26% per annum gain with volatility of 57% over the last six years.

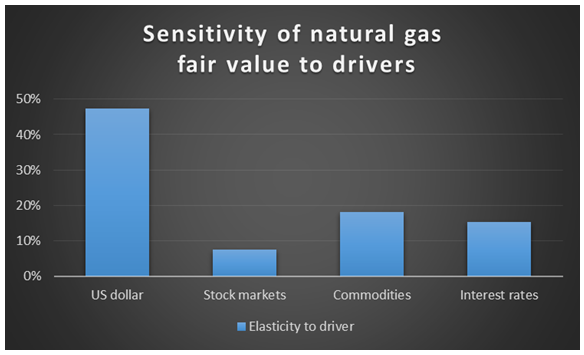
The graph above shows the sensitivity of natural gas’ fair value to the drivers on which the fair value is based As can be seen, natural gas is positively correlated to the US dollar. Our fair value indicators suggest some short-term upside in the US dollar index which does bode well for the natural gas price. Conversely, the indicators suggest short-term downside in commodity prices, which would hold back the commodity’s price.
The above discussion has touched on the volatility of natural gas prices and observations on future price direction, and position sizing, must be tempered by this volatility which is far higher than for most other commodities.
