There are a couple of pet peeves I have with articles from so-called “analysts” regarding their technical outlooks on various financial instruments.
(1) When they’re wrong, they never admit it
(2) Their disclaimers evaporate all their credibility
Allow me to explain.
Wrong is Normal
In my business we exclusively trade energy. That means we spend an inordinate amount of time looking at charts and coming to technical conclusions. I find we can be wrong from time to time on things like timing of our expectations, however typically not from a larger picture perspective. However, no analyst is infallible.
As an analyst who trades energy for profit, you constantly wonder if you’re over-analyzing charts, or your conclusions are based on a preconceived notion, or position bias. I find I am constantly self-reflecting to be aware if my technical conclusions are free of these things or clouded. Nonetheless, I recently wrote an article that outlined a decline in Natural Gas to the $2.80 to $3.00 level. Since that article was published the commodity has rallied about 6%.
Clearly I was wrong. But is this a case of wrong on timing, or wrong in my analysis? Granted I have my own opinions but truly only time will tell which, and the commodity always has the final word.
Our trading room deploys Elliott Wave Theory primarily to forecast price. This analytical tool suits us uniquely because of the defined rules and guidelines in which any analyst can use this tool successfully. Let’s examine that analysis from my May 9th article.
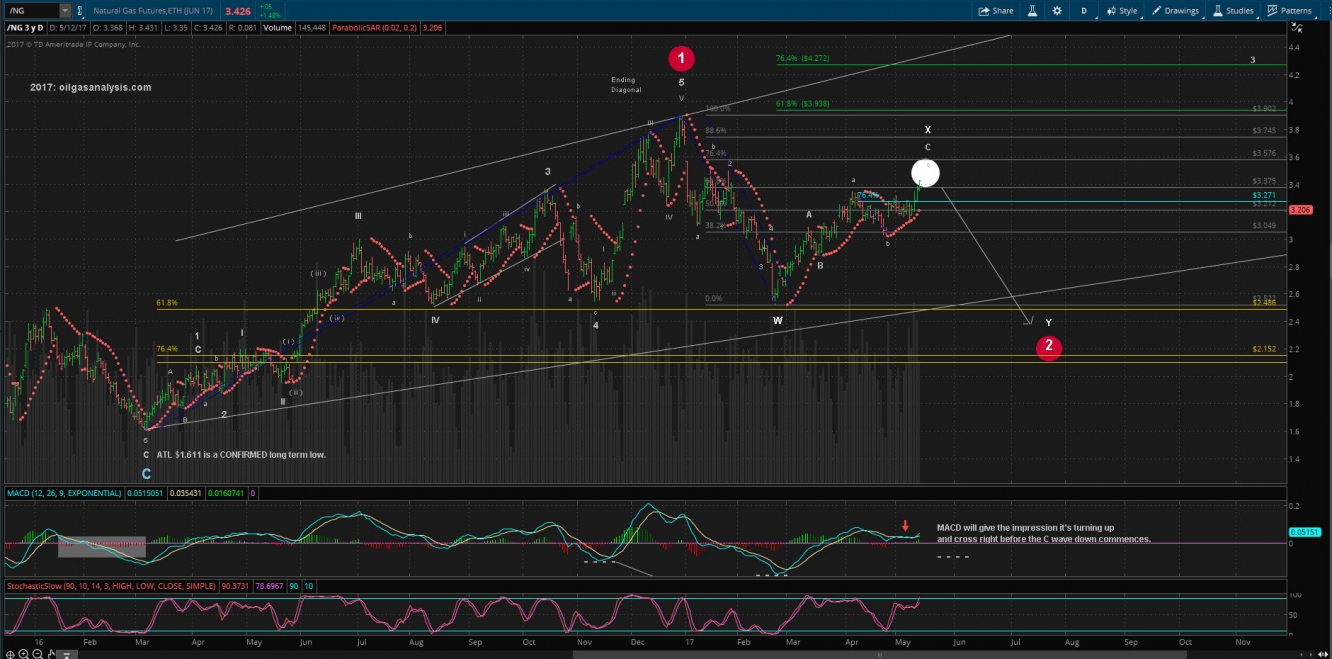
As you can see from the below chart, NatGas bottomed at $1.611 on March 4, 2016. I wrote extensively on why this is a confirmed bottom and I encourage those reading this article to go back to read my analysis.
The commodity rose in price until December 28, 2016 and reversed at $3.902. The time frame it took NatGas to complete the rally (which we’ve labeled wave 1) was 8.75 months. A decline or retracement from wave 1 top would constitute a wave 2.
Elliott wave guidelines clearly state that a wave 2 retracement should take no less than 50% of the time of wave 1 and up to 162%. NatGas ultimately retraced from $3.902 to bottom at $2.522 on February 22, 2017. Price came into an area where a wave 2 should bottom (Guidelines for wave 2 are in the area of prior wave’s minor wave 4). So price bottomed in the textbook area of a wave 2 but the time frame was only 2 months or 23% of the timeframe of wave 1.
In conclusion, although price fulfilled the proper level for a wave 2 bottom, the timeframe did not meet the minimum guideline requirement. The minimum requirement would be a bottom at the earliest in early May and the latest in April 2018.
Therefore I’ve had no choice but to keep an open mind about some sort of decline that will at least take us back to the $3 level. As long as $3.902 holds, I have to consider that price will rally and decline within the range of $3.902 and $2.522 for some time to come.
So where I can clearly admit I was wrong in my May 9th analysis is on timing. Nevertheless,I believe my further downside thesis is sound and remains a reasonable probability trade according to EW guidelines.
Note: An Elliott Wave guideline is different from a rule. Elliott Wave, guidelines can be broken and still be perfectly within the parameters of proper use of Elliott Wave analysis. On the other hand, Rules cannot be broken. My further decline thesis is based on my personal analysis giving it a higher probability than a rally to new highs without further time to consolidate the gains made from $1.611 up to $3.902 based on timeframe guidelines.
How would my further decline thesis play out?
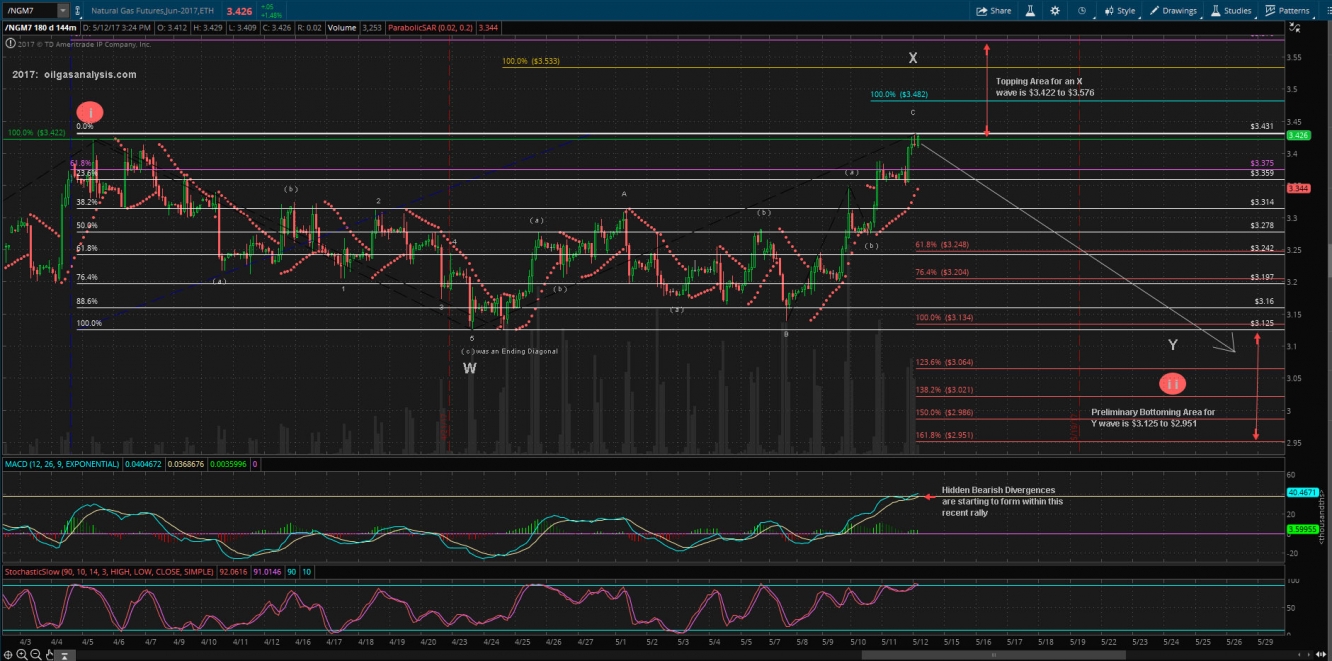
In the below 144 min chart I label how this decline could resolve itself. Take note of the above resistance we’re about to encounter. Many sub pattern Fibonacci 1.0 extensions and the powerful .764 retracement level of the initial decline will act as formidable resistance for the commodity.
To summarize, we have many areas of formidable resistance ahead. The technicals are starting to flash some bearish tendencies (MACD starting to form Hidden Bearish Divergences) that are looming within this rally. I think traders of NatGas should keep an open mind as there appears to be a reasonable probability we could be mired in a protracted consolidation that may take several months or more to resolve.
When Analyst Disclaimers Evaporate their Creditability
If you’re like me, you trade the markets for profit. That means there is real money at risk. I have always found it hard to digest when I read an article and at the very end the writer discloses they have no positions and do not plan on initiating any new positions. Is that supposed to say to me they have no conflicts of interest? Wait a minute. They’re not managing my money.
They are arguing the substance of their analysis and if they won’t put money behind their work, why should I?
In reality I think most people would risk something for a perspective they felt was a reasonable outcome. Therefore I conclude this article with the below disclaimer.
Disclaimer: We’re short OTM calls on NatGas that expire both in May and June. We clearly have a short bias in the short term.


