Bottom Line: Natural Gas is poised to either continue its existing correction that began in either December 2005 or July 2008 or begin the transition into a move up that could eventually test these highs
.
Monthly Chart 
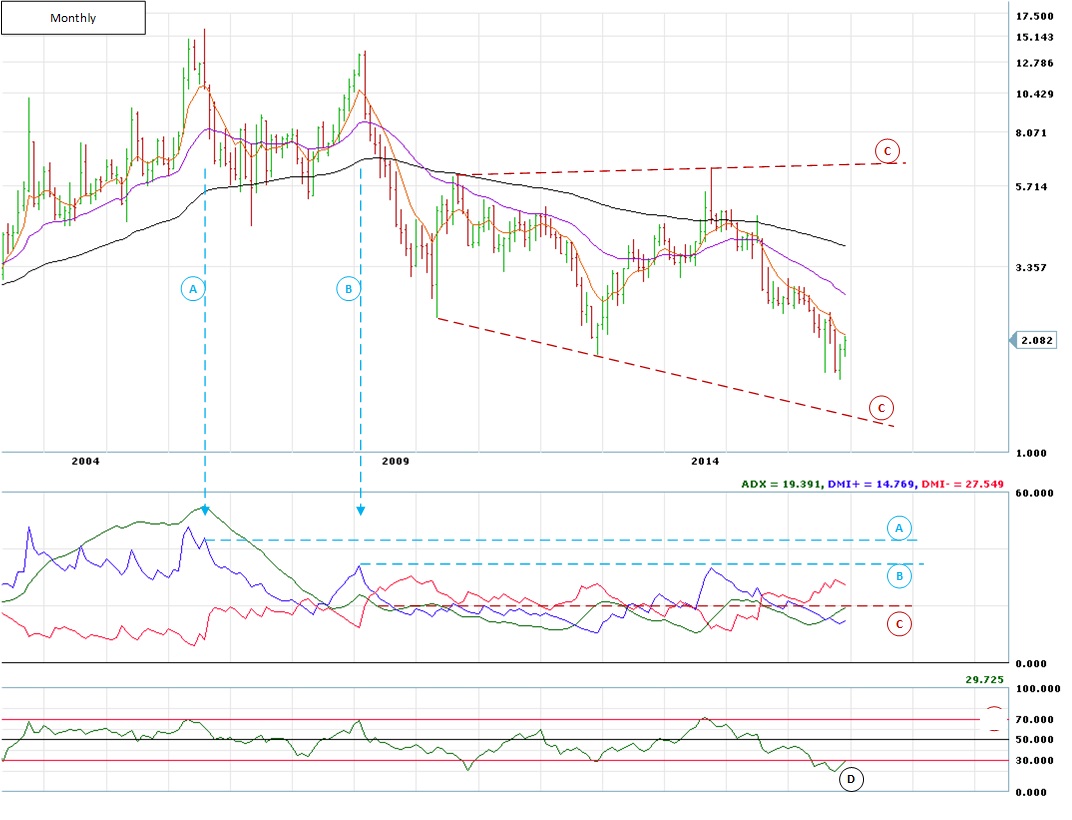
This conclusion is drawn from the monthly chart (displayed is a logarithmic, continuation chart with the current spot contract). First, which is the actual high (A) or (B)? In considering a line chart of the Natural Gas monthly cash prices, I believe that (A) is the high and that (B) is part of the correction that began in late 2005.
*+DI that corresponds to the high in price has not been taken out by a -DI during the past 11 years. If the alternate high was used, its +DI would not have been taken out by a -DI either so in either case, the price movement since 2005 should be viewed as a correction
*The ADX has be at or below 20 since 2009 which has setup the trading range that price has been in to-date. When reading the ADX, one of the principles that I follow is that when the ADX is below 20 and/or the DI’s, look for patterns on the chart and then watch for breakouts. By drawing a line at the 20 segment on the ADX (C) and then looking up at price during this same time frame, we can what appears to be an expanding triangle (C).
*The 21P RSI had recently move in to an oversold condition but has begun to pull back in the past two months
From the indicators on the monthly chart, it seems that a logical conclusion is that price will move lower.
*There is nice separation between the EMAs (7P, 26P, and 90P) with all point down and price below all there.
*The -DI is separating nicely from the +DI and the ADX turned up several months back and if close to if not at 20
The one interesting indicator is the 21P RSI which went well into the oversold range but has recently began to pull back.
It is possible for the -DI to continue to move up without challenging the upper +DI boundary (A) accompanied with price moving lower. The 21P RSI could move up in this scenario causing divergence to form with price which may be a better setup of price to move up once this 11-year correction ends.
Weekly Chart 
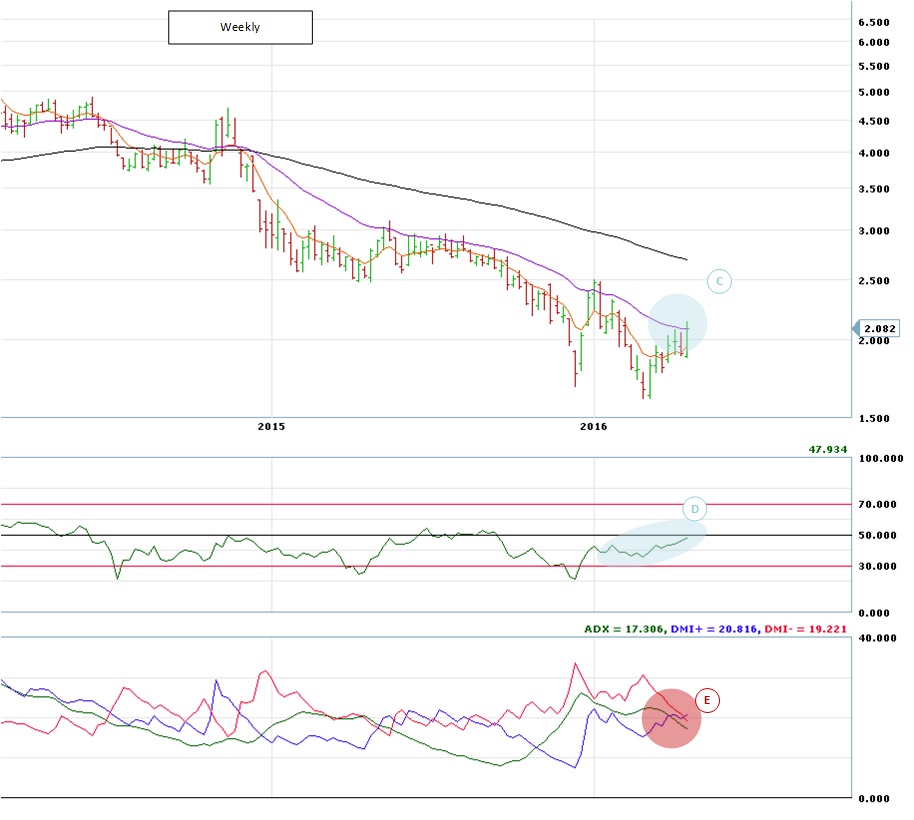
The weekly chart confirms what the monthly chart is showing as far as price action and potential direction is concerned.
*The 26P EMA is currently be challenged but as of this writing has held and the 90P EMA has good separation between the 7P and 90P EMA (C).
*The 21P RSI has pulled back from its oversold condition in early 2016 and is not approaching the 50 range. It’s key for this range to hold 45-55 to keep this timeframe downtrend intact.
*The 14P +/-DI have converged and the ADX has pullback below both and 20. This indicator is signaling that the current weekly downtrend could be coming to an end. With the ADX dropping below 20 and the +/-DI, a period of price consolidation should begin which may be enough to keep price around the 26P EMA and the 21P RSI in the 45-55 range.
Daily Chart
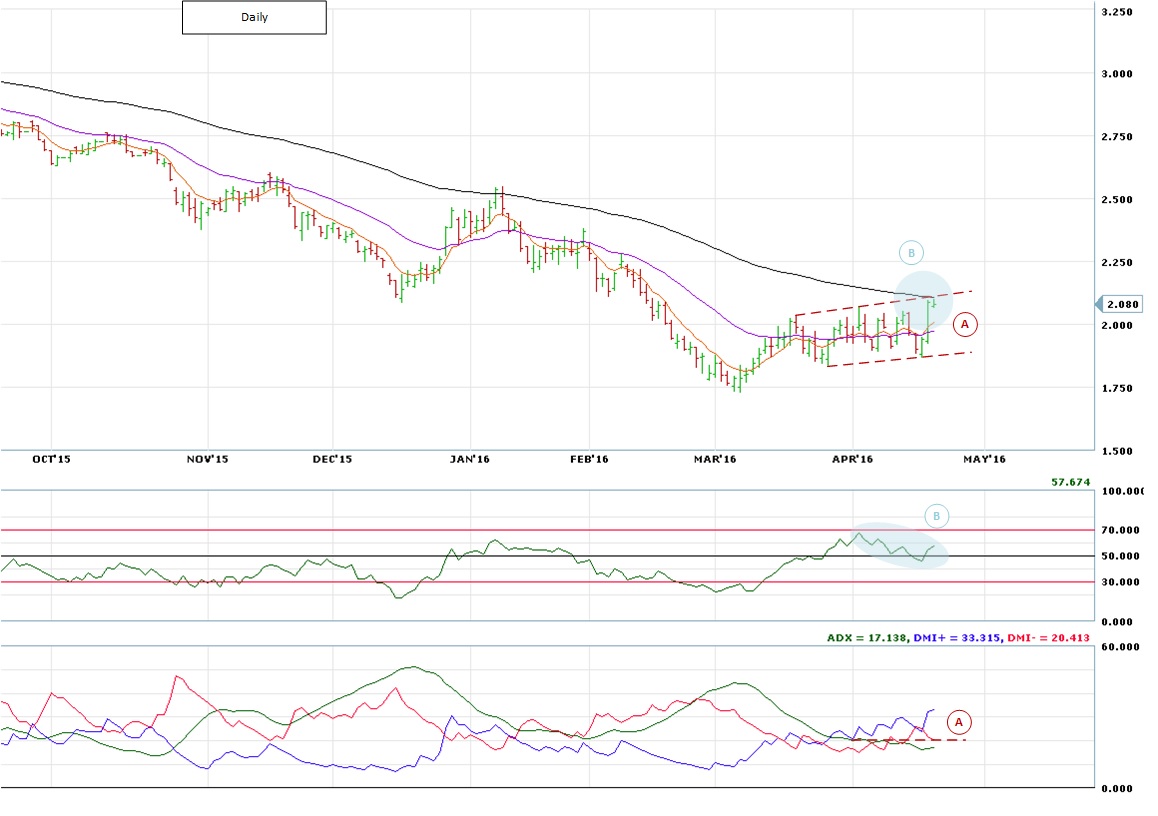
The daily chart is pushing against major resistance in the 90P EMA(B). It is key for this to hold in order for the short term trend to hold. Should price break above this link and hold, a short term correction could begin.
*Since early April, the ADX has hit or dropped below 20. During this timeframe, price has traded within a time channel and is currently at the upper end of it (A). Should this resistance hold, price should continue down in the larger move.
120 Minute Chart 
Next Steps:
Watch the 120M chart along with the daily chart
Scenario 1:
*Price turns down and moves below the 90P EMA on the 120M chart taking the 7P and 26P EMA with it.
*21P RSI on the 120M chart drops below the 50 range
*-DI crosses up over the +DI on the 120M chart
*Price turns down and drops below the 7P and 26P EMA. Price is able to break out to the down side of the lower channel line (A).
*The -DI crosses up over the +DI on the daily chart
*The 21P RSI crosses below 50 and holds
Scenario 2:
*Price, on the 120M chart, is in process of running a correction and finds support at the 26P EMA. Once price finds support here (possibly the 90P too), it begins to move up. In this scenario, the 21P RSI would find support in the 50 range and the +DI would remain above the -DI
*Price, on the daily chart, holds near the upper channel line (A) and possibly finds support on the 7P EMA. The RSI comes back to the 50 range but does not fall below it. The +DI remains above the -DI and the ADX begins to move up. If these conditions hold, then price should move up above the 90P EMA and the upper channel line (A) bringing along the 21P RSI and the ADX/+DI
For now, I’d stand aside until price tips its hand and then trade the direction against a pullback. Should scenario 1 playout, price could move down to the lower channel line (C) on the monthly chart. Scenario 2 doesn’t necessarily imply the long term correction is over as the 26P EMA on the monthly chart could still provide resistance to push price lower even if it does move up in short term.
