Natural-gas futures fell further on Thursday after the U.S. Energy Information Administration reported an 88 billion cubic foot rise in U.S. inventories for the week ended May 24. Analysts polled by Plats forecasted a climb between 87 billion cubic feet and 91 billion cubic feet. July natural gas NGN13 -2.43% was at $4.08 per million British thermal units, down 9 cents, or 2.3%. It was trading at $4.13 shortly before the data. Our regular readers know that our last target was 4.121 and 4.300.

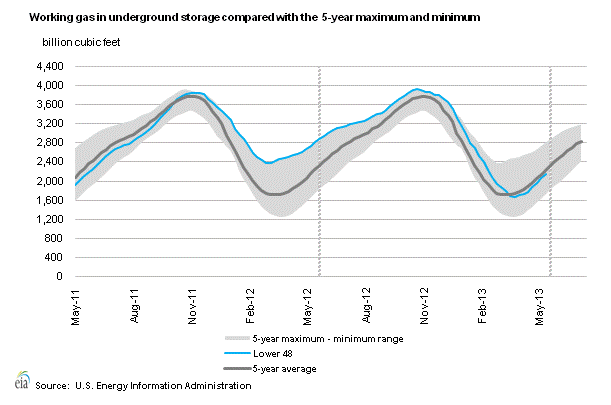
Working gas in storage was 2,141 Bcf as of Friday, May 24, 2013, according to EIA estimates. This represents a net increase of 88 Bcf from the previous week. Stocks were 664 Bcf less than last year at this time and 88 Bcf below the five-year average of 2,229 Bcf. In the East Region, stocks were 110 Bcf below the five-year average following net injections of 53 Bcf. Stocks in the producing region were 25 Bcf below the five-year average of 876 Bcf after a net injection of 23 Bcf. Stocks in the West region were 47 Bcf above the five-year average after a net addition of 12 Bcf. At 2,141 Bcf, total working gas is within the five-year historical range. 
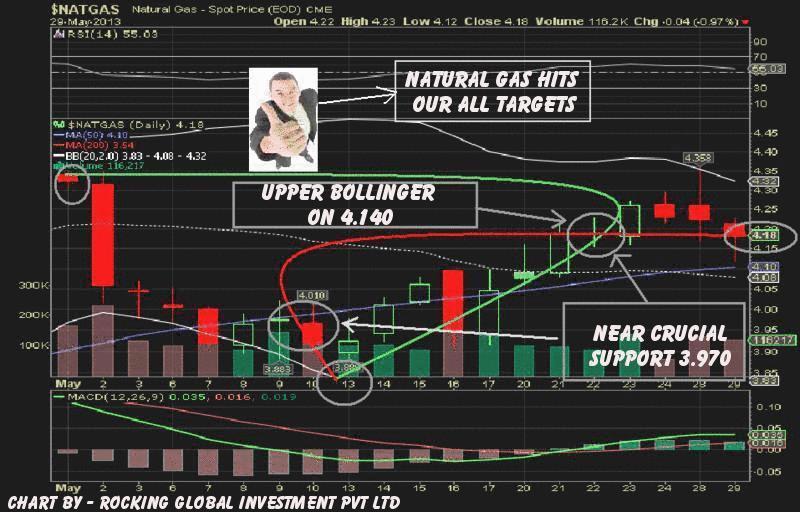
Natural gas was breaking its 50-day SMA (4.100), a negative sign for the short term. On monthly chart, U.S. Natural gas creates a rectangle triangle format in an up trend, indicating that its new bearish trend may start below 3.970. You can see more selling pressure at 3.933 and 3.900.
Monthly boom trend 60 Percentages “Bull Retrenchment” was completed around 4.066. The Natural gas upper Bollinger® band creates above 4.140 on the monthly candlestick. You can see more upside level at 4.190 and 4.233 if natural gas crosses its crucial resistance of 4.140 and closes on it.
- English (UK)
- English (India)
- English (Canada)
- English (Australia)
- English (South Africa)
- English (Philippines)
- English (Nigeria)
- Deutsch
- Español (España)
- Español (México)
- Français
- Italiano
- Nederlands
- Português (Portugal)
- Polski
- Português (Brasil)
- Русский
- Türkçe
- العربية
- Ελληνικά
- Svenska
- Suomi
- עברית
- 日本語
- 한국어
- 简体中文
- 繁體中文
- Bahasa Indonesia
- Bahasa Melayu
- ไทย
- Tiếng Việt
- हिंदी
Natural Gas Hits Targets: What’s Next?
Published 05/30/2013, 01:36 PM
Updated 07/09/2023, 06:32 AM
Natural Gas Hits Targets: What’s Next?
3rd party Ad. Not an offer or recommendation by Investing.com. See disclosure here or
remove ads
.
Latest comments
right sir. I was get good profit in your last call. Your both target achieved. Thank you very much.
Install Our App
Risk Disclosure: Trading in financial instruments and/or cryptocurrencies involves high risks including the risk of losing some, or all, of your investment amount, and may not be suitable for all investors. Prices of cryptocurrencies are extremely volatile and may be affected by external factors such as financial, regulatory or political events. Trading on margin increases the financial risks.
Before deciding to trade in financial instrument or cryptocurrencies you should be fully informed of the risks and costs associated with trading the financial markets, carefully consider your investment objectives, level of experience, and risk appetite, and seek professional advice where needed.
Fusion Media would like to remind you that the data contained in this website is not necessarily real-time nor accurate. The data and prices on the website are not necessarily provided by any market or exchange, but may be provided by market makers, and so prices may not be accurate and may differ from the actual price at any given market, meaning prices are indicative and not appropriate for trading purposes. Fusion Media and any provider of the data contained in this website will not accept liability for any loss or damage as a result of your trading, or your reliance on the information contained within this website.
It is prohibited to use, store, reproduce, display, modify, transmit or distribute the data contained in this website without the explicit prior written permission of Fusion Media and/or the data provider. All intellectual property rights are reserved by the providers and/or the exchange providing the data contained in this website.
Fusion Media may be compensated by the advertisers that appear on the website, based on your interaction with the advertisements or advertisers.
© 2007-2024 - Fusion Media Limited. All Rights Reserved.
