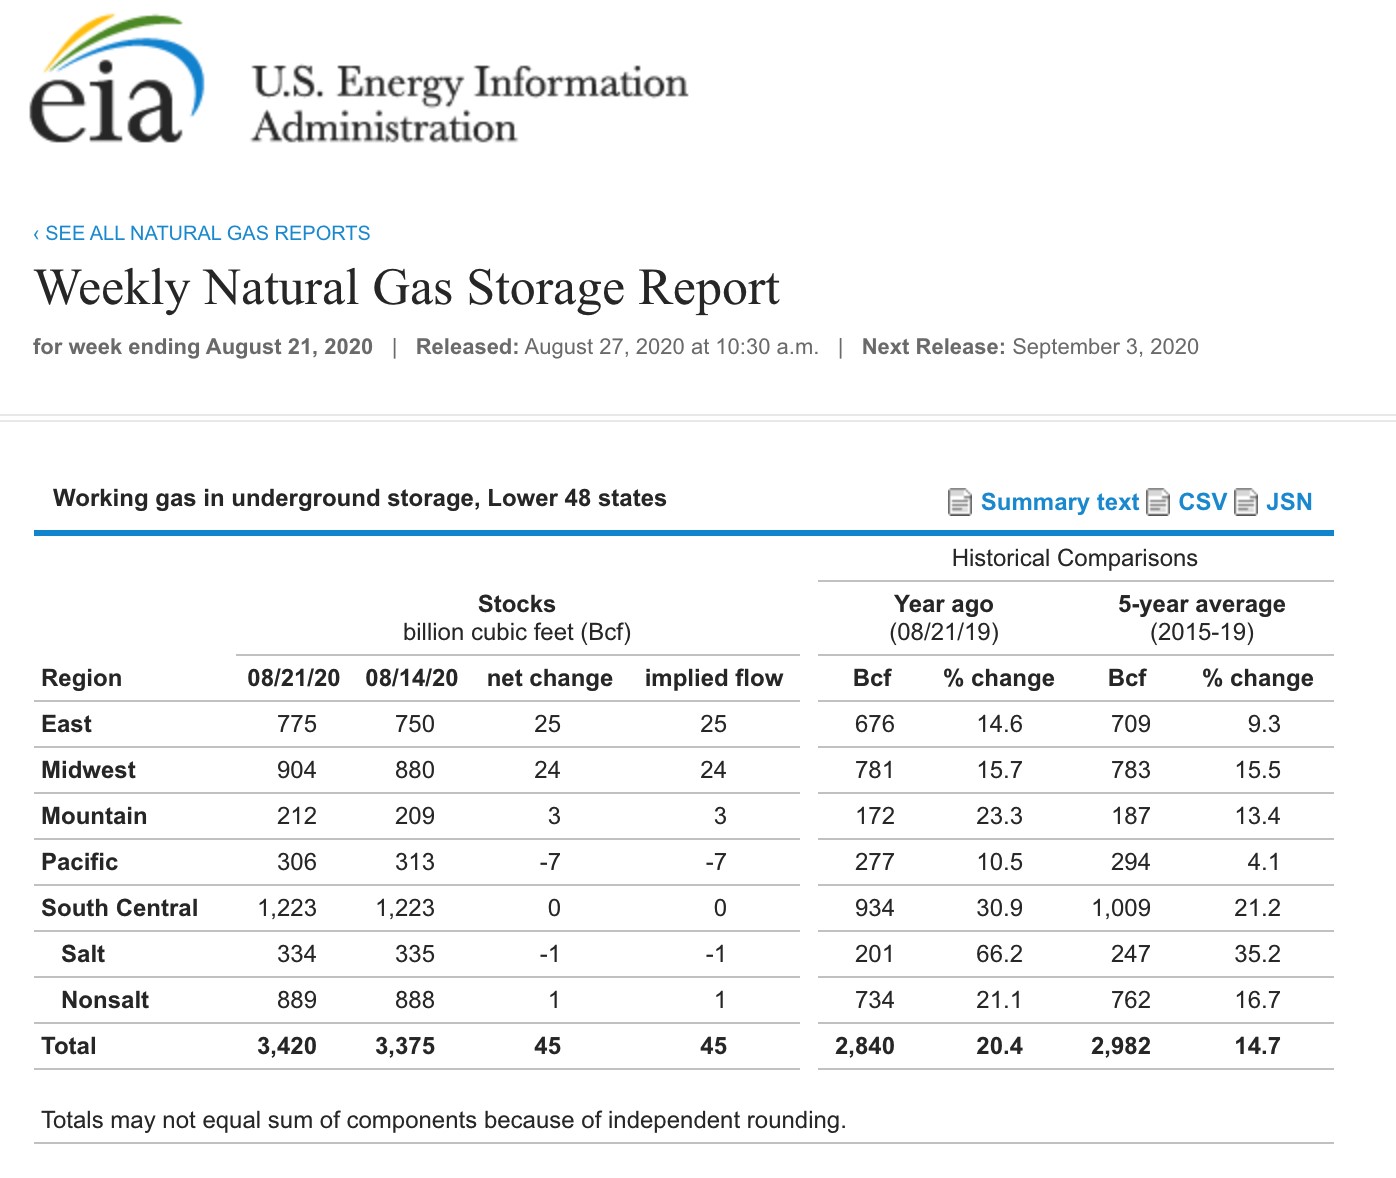
- The market expected a 48 bcf injection into storage for the week ending on Aug. 21
- Natural gas rallies to a new high for 2020
- It is early in the year, and inventories are high, but the target is now at the November 2019 peak
The price of natural gas has been moving steadily to the upside since late July. After falling to the lowest price since 1995, the energy commodity has staged an impressive recovery. The continuous contract low was at $1.432, and the active month October futures contract traded to a bottom of $1.70 per MMBtu in late June. Even though the stockpiles of natural gas in storage across the United States remain appreciably above last year’s level and the five-year average for this time of the year, the price action has been bullish.
On Thursday, Aug. 27, the Energy Information reported stockpiles data as of the week ending on Aug. 21. The injection season has approximately 12 weeks left before inventories begin to decline during the peak season of demand during the winter months. The United States Natural Gas Fund (NYSE:UNG) moves higher and lower with the price of natural gas futures on the NYMEX division of the Chicago Mercantile Exchange.
Market Expected 48 bcf Injection Into Storage For Week Ending Aug. 21
A combination of another small injection into inventories as of April 21 and Hurricane Laura that hit the states on the Gulf of Mexico continued to push natural gas higher. According to Estimize, a crowdsourcing website, the market had expected a 48-billion-cubic-feet injection into storage across the U.S. for the week ending on Aug. 21.

Source: EIA
As the chart highlights, the EIA reported that inventories increased by 45 billion cubic feet in its latest report. Stockpiles of the energy commodity rose to 3.420 trillion cubic feet, 20.4% above last year’s level, and 14.7% over the five-year average for this time of the year.

Source: CQG
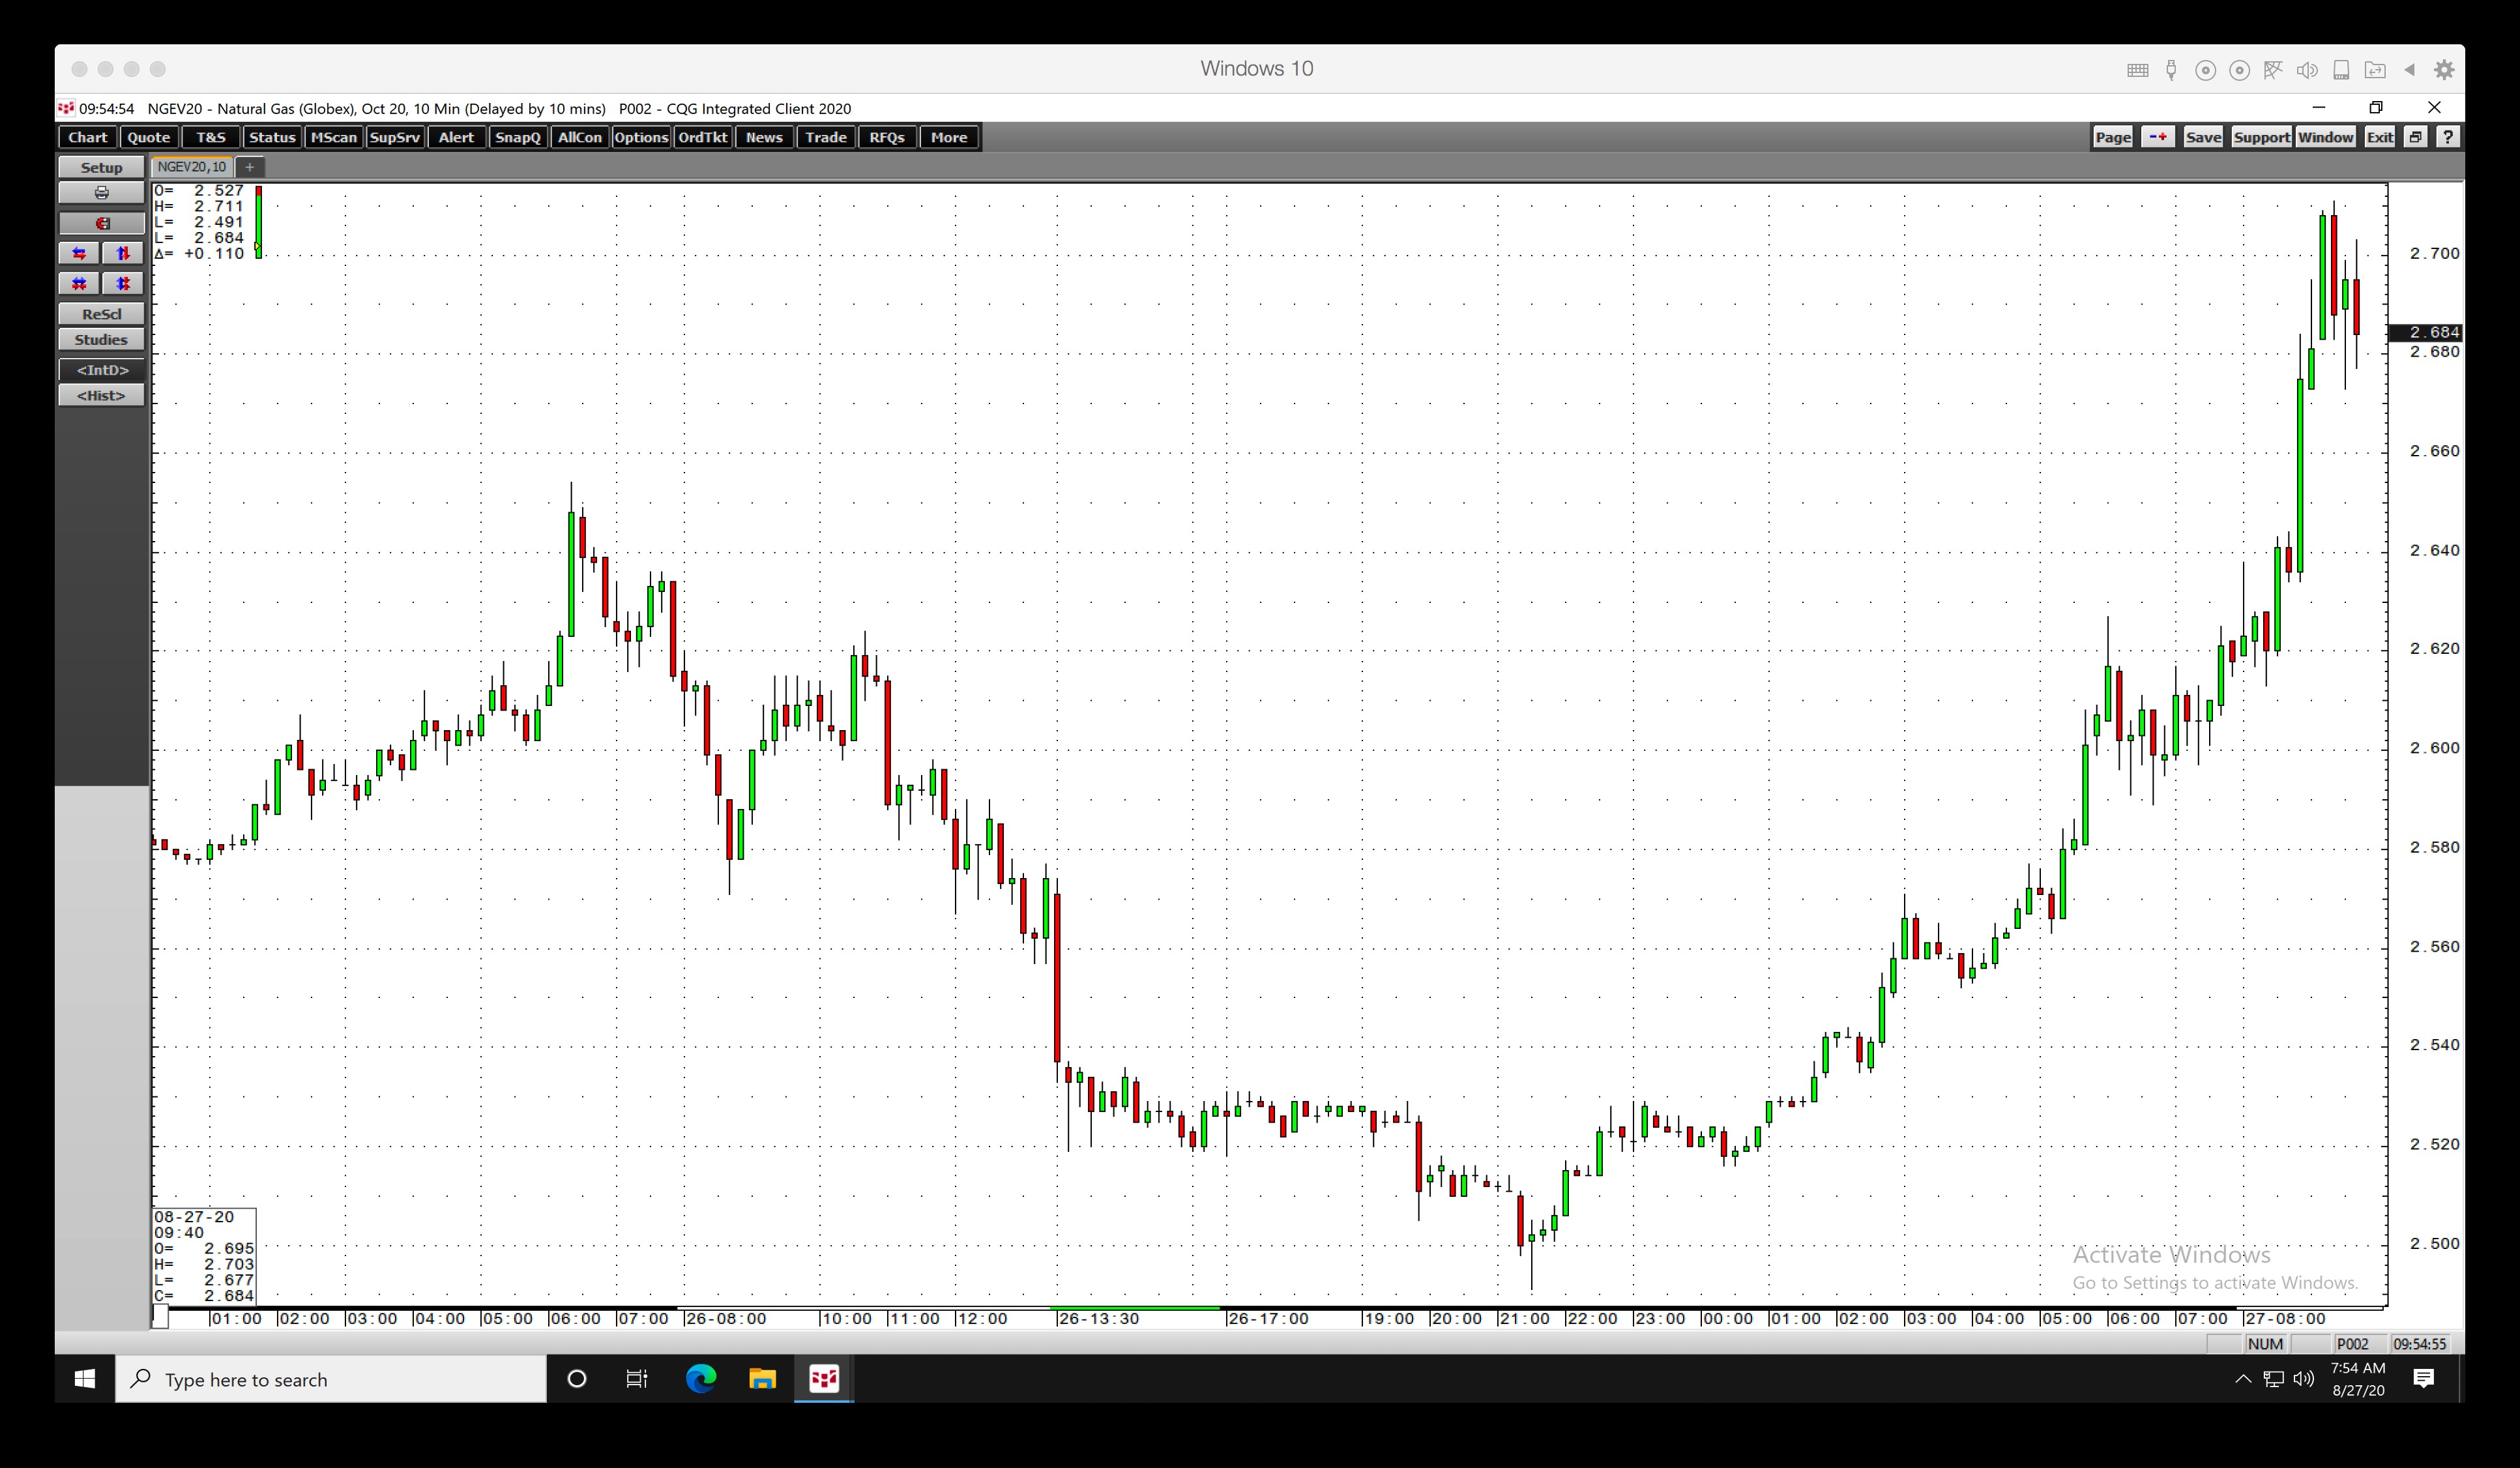
The chart of active month October natural gas futures shows that the price rose to a high of $2.711 per MMBtu before the EIA’s latest data release. Hurricane Laura was largely responsible for the rally, but the price trend for the energy commodity has been higher since late June.
Natural Gas Rallies To New High For 2020
If October natural gas futures settle above $2.654 on Aug. 27, they will put in a bullish reversal on the daily chart.

Source: CQG
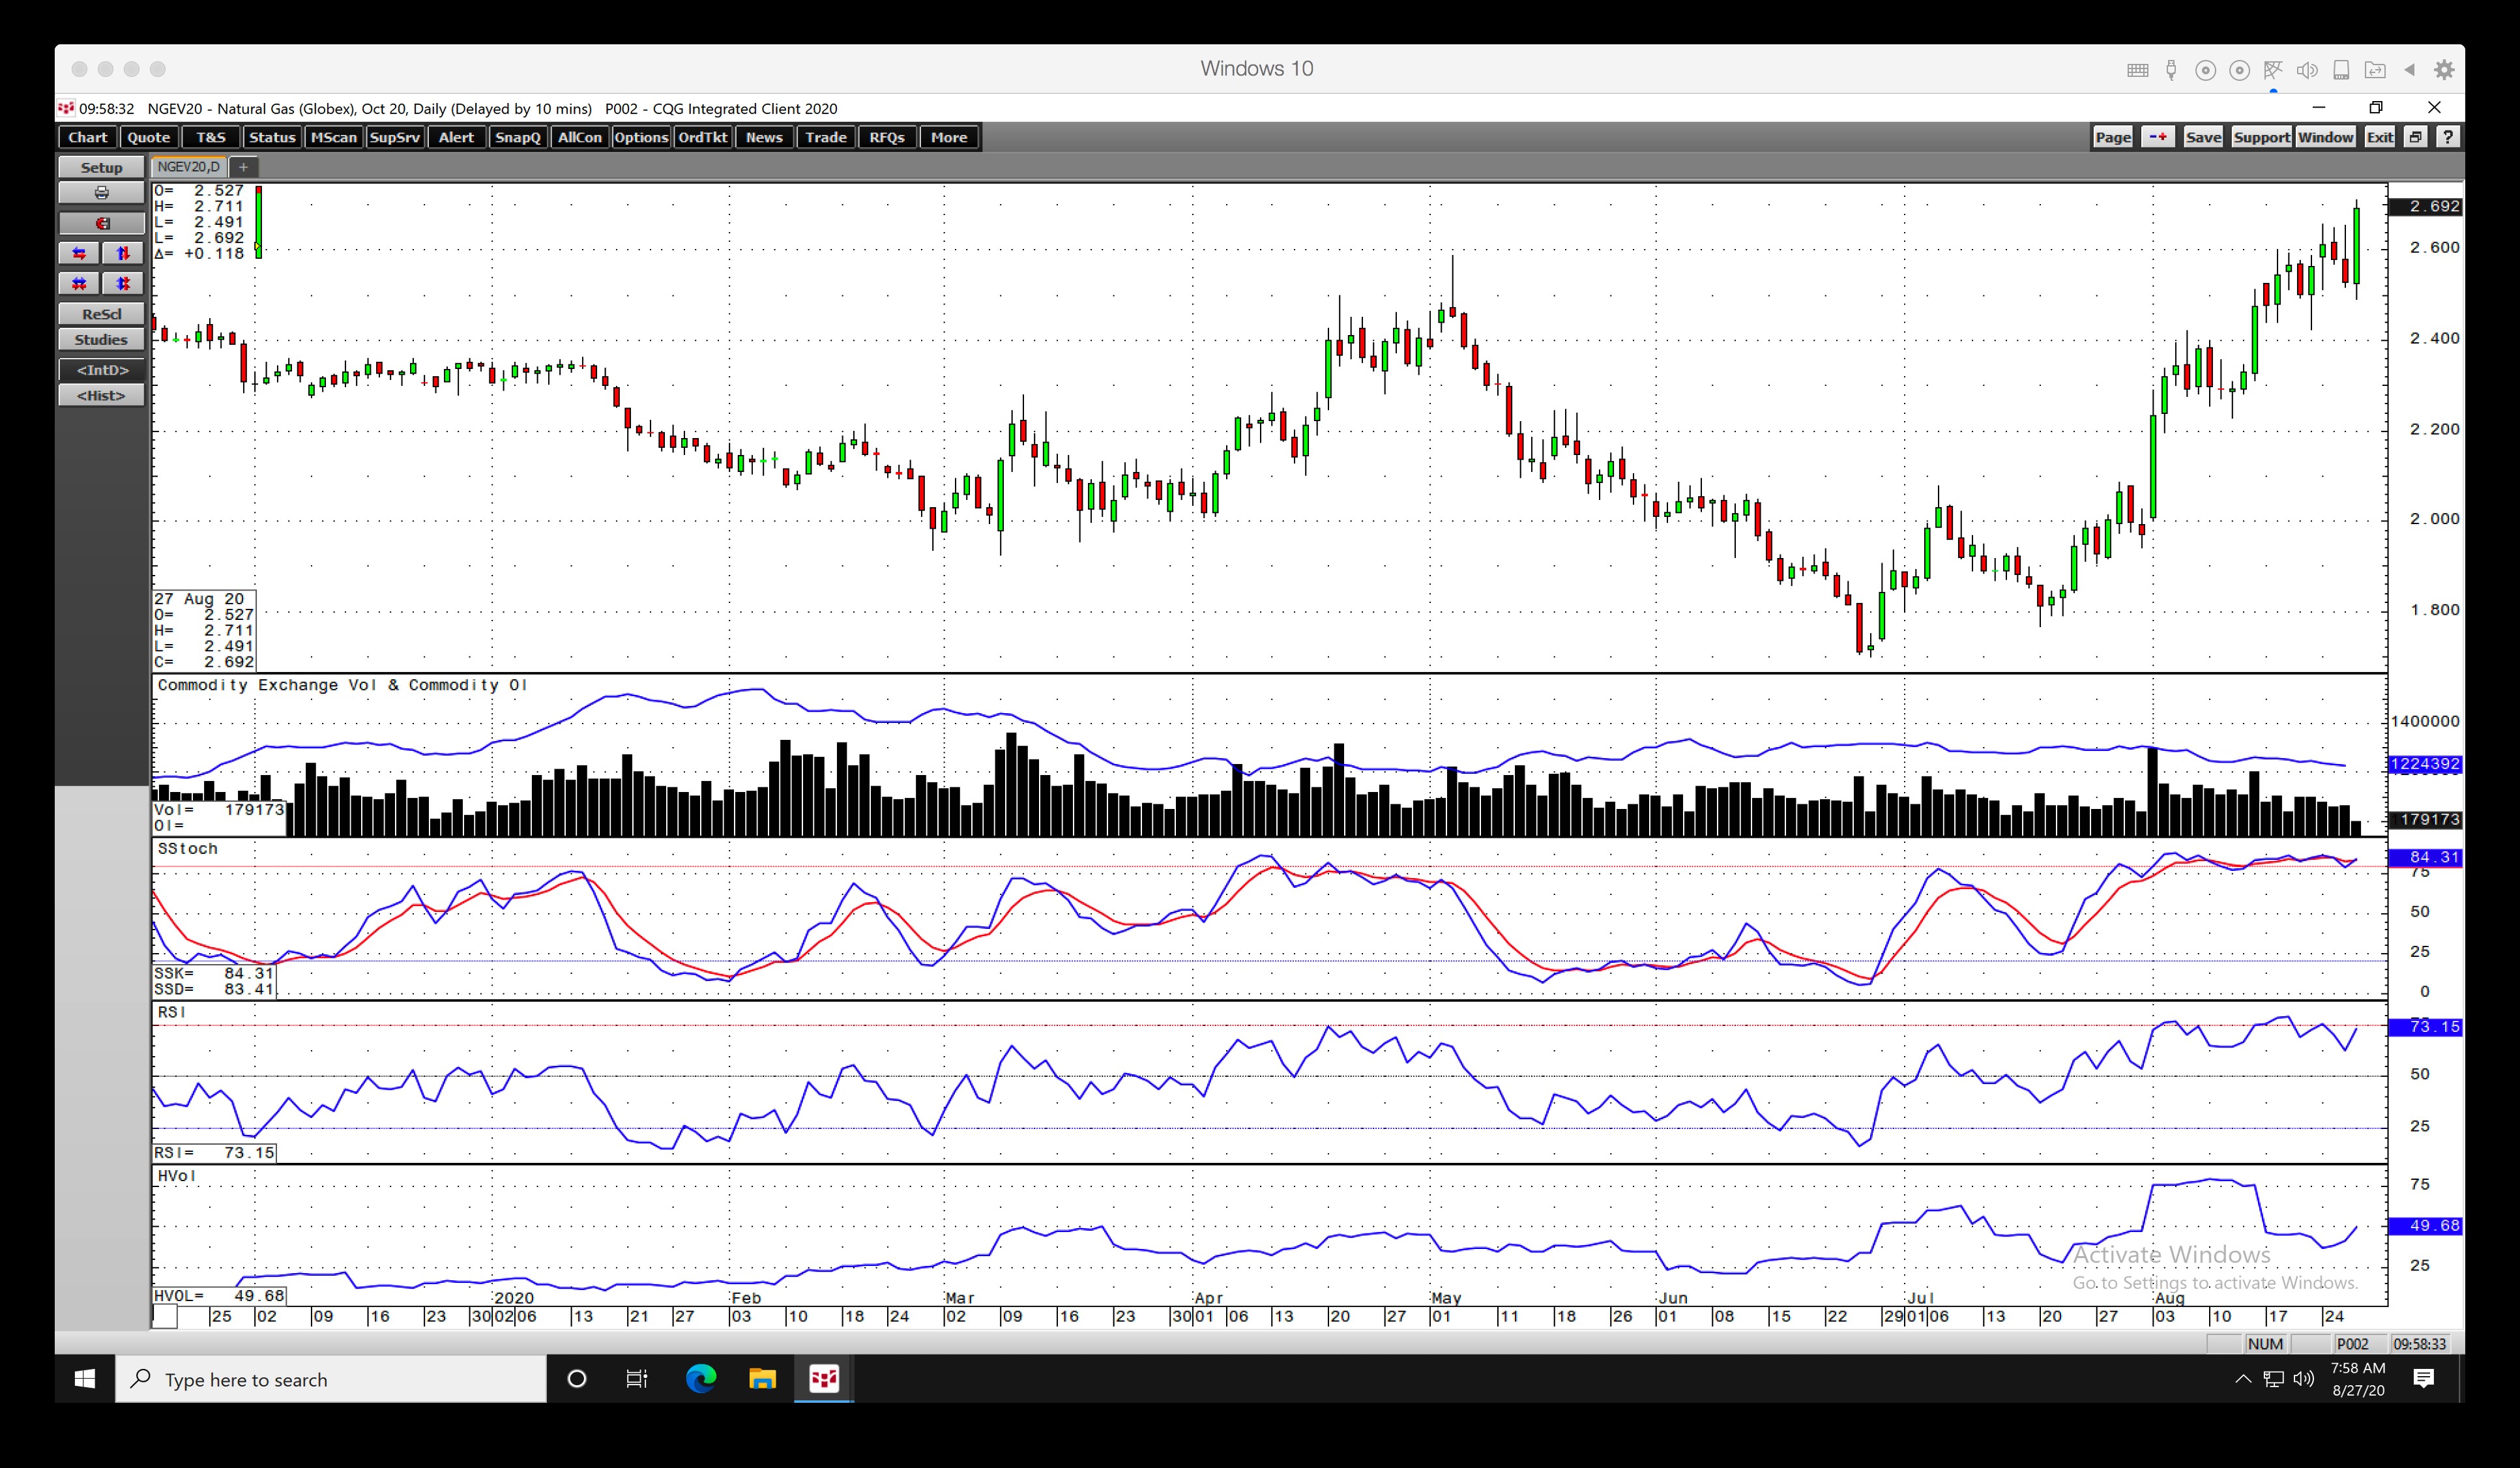
The rise to a high of $2.711 on Thursday, put natural gas at a new high for 2020. The continuous contract traded to a high of $2.594, the highest price since November 2019. Price momentum and relative strength indicators were heading for overbought conditions. Daily historical volatility was just over 50%. The open interest metric at 1.224 million contracts continued to edge lower as the price moves higher. While falling open interest and rising price is not a technical validation of a bullish trend in a futures market, it is likely that short covering continues to be responsible for the decline in the total number of open long and short positions.
The trend is always your friend in futures markets, and in natural gas, it remains higher. A combination of the Hurricane Laura’s impact and a small injection into storage pushed the price above the $2.70 per MMBtu level on the October futures contract.
It Is Early In Year, And Inventories Are High, But Target (NYSE:TGT) Now At November 2019 Peak
We are at the tail end of the summer season and the height of the time of the year when the danger of hurricanes is at a peak. With lots of natural gas infrastructure near the Gulf of Mexico, the energy commodity is highly sensitive to storms in the region. In 2005 and 2008, Hurricanes Katrina and Rita pushed the price of the energy commodity to over $10 per MMBtu. The delivery point for NYMEX natural gas is in Erath, Louisiana.
Meanwhile, inventories at 3.420 tcf on Aug. 21, which was 20.4% below last year, was the 21st consecutive week where the percentage below last year declined. With approximately 12 weeks to go before the beginning of the 2020/2021 withdrawal season, inventories only need to rise by an average of 40.7 bcf to reach last year’s peak at 3.732 tcf. Reaching 4 trillion cubic feet for the third time since the EIA began reporting storage data would require an average injection of 48.4 bcf.
The next technical level on the continuous contract stands at the November 2019 high of $2.905 per MMBtu. The trend in the natural gas futures market remains higher, but the amount of the energy commodity in storage across the U.S. suggests that the $2.905 or $3 levels could be a challenge as there are plenty of stockpiles to meet any requirements from the coming winter season.
If Hurricane Laura does not damage natural gas infrastructure, a downside correction could be on the horizon.
