
We have mentioned several times recently that the NASDAQ has been the lone holdout in the broad market, in terms of it being the only index holding above its 50-day moving average.
Even with yesterday’s sharp losses, the index is still above this important level of support (but now within 1% of it).
This is shown below on the daily chart of PowerShares QQQ Trust (QQQ), a popular ETF proxy for the Nasdaq 100 Index (which has a similar chart pattern to the NASDAQ Composite):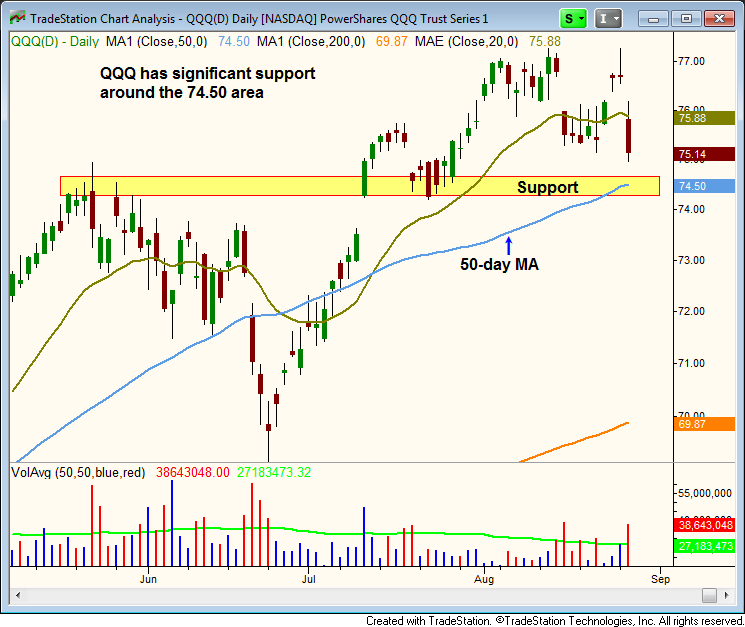
Despite yesterday’s swift drop that caused QQQ to break support of its prior swing lows from last week, notice the index is now less than 1% above a major level of horizontal price support that was formed by the prior highs of May, the lows of mid-July, and the 50-day moving average.
This triple convergence of price support could be significant enough to spark a bounce in the Nasdaq in the coming days, so keep a close eye on this level.
Conversely, the S&P 500 is now trading firmly below its 50-day moving average. As you can see on the chart of S&P 500 SPDR (SPY) below, the benchmark S&P 500 is technically in much worse shape than the NASDAQ: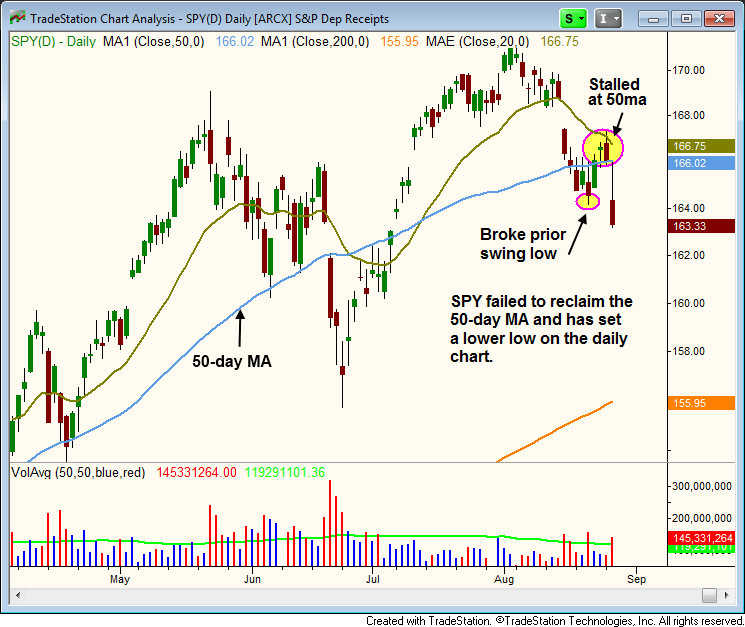
Before yesterday’s decline, SPY had managed to reclaim support of its 50-day moving average. However, the index only managed to hold above that pivotal level for two days before falling back down (in a big way). The Dow Jones is in even worse shape because the index is already testing crucial support of its June 2013 lows. By comparison, notice how far above their respective June lows both the NASDAQ and S&P 500 remain.
For now, our market timing system remains in “neutral” mode. The only reason it has NOT yet shifted to “sell” mode is because the NASDAQ continues to hold above key, intermediate-term support of its 50-day moving average.
Nevertheless, if the NASDAQ joins the S&P 500 and Dow Jones Industrial Average in breaking down below its 50-day moving average as well, there would no longer be any reason to be on the long side of the market (with the exception of ETFs with low correlation to stock market direction).
Because we are trend traders, a shift to “sell” mode would also enable us to start selling short (stocks with relative weakness) and/or maintain a heavy cash position. All bets for individual stocks on the long side of the market would also be off.
Original post
- English (UK)
- English (India)
- English (Canada)
- English (Australia)
- English (South Africa)
- English (Philippines)
- English (Nigeria)
- Deutsch
- Español (España)
- Español (México)
- Français
- Italiano
- Nederlands
- Português (Portugal)
- Polski
- Português (Brasil)
- Русский
- Türkçe
- العربية
- Ελληνικά
- Svenska
- Suomi
- עברית
- 日本語
- 한국어
- 简体中文
- 繁體中文
- Bahasa Indonesia
- Bahasa Melayu
- ไทย
- Tiếng Việt
- हिंदी
Nasdaq Nearing Key Support Level, Despite Yesterday’s Plunge
Published 08/28/2013, 03:18 AM
Updated 07/09/2023, 06:31 AM
Nasdaq Nearing Key Support Level, Despite Yesterday’s Plunge
3rd party Ad. Not an offer or recommendation by Investing.com. See disclosure here or
remove ads
.
Latest comments
Install Our App
Risk Disclosure: Trading in financial instruments and/or cryptocurrencies involves high risks including the risk of losing some, or all, of your investment amount, and may not be suitable for all investors. Prices of cryptocurrencies are extremely volatile and may be affected by external factors such as financial, regulatory or political events. Trading on margin increases the financial risks.
Before deciding to trade in financial instrument or cryptocurrencies you should be fully informed of the risks and costs associated with trading the financial markets, carefully consider your investment objectives, level of experience, and risk appetite, and seek professional advice where needed.
Fusion Media would like to remind you that the data contained in this website is not necessarily real-time nor accurate. The data and prices on the website are not necessarily provided by any market or exchange, but may be provided by market makers, and so prices may not be accurate and may differ from the actual price at any given market, meaning prices are indicative and not appropriate for trading purposes. Fusion Media and any provider of the data contained in this website will not accept liability for any loss or damage as a result of your trading, or your reliance on the information contained within this website.
It is prohibited to use, store, reproduce, display, modify, transmit or distribute the data contained in this website without the explicit prior written permission of Fusion Media and/or the data provider. All intellectual property rights are reserved by the providers and/or the exchange providing the data contained in this website.
Fusion Media may be compensated by the advertisers that appear on the website, based on your interaction with the advertisements or advertisers.
© 2007-2024 - Fusion Media Limited. All Rights Reserved.