Get 40% Off
💰 Buffett reveals a $6.7B stake in Chubb. Copy the full portfolio for FREE with InvestingPro’s Stock Ideas toolCopy Portfolio

NASDAQ Creating Topping Pattern Similar To 2000 Tech Highs?

Published 02/27/2020, 07:24 AM
Updated 07/09/2023, 06:31 AM
IXIC
-
Nasdaq Composite Index Monthly Chart

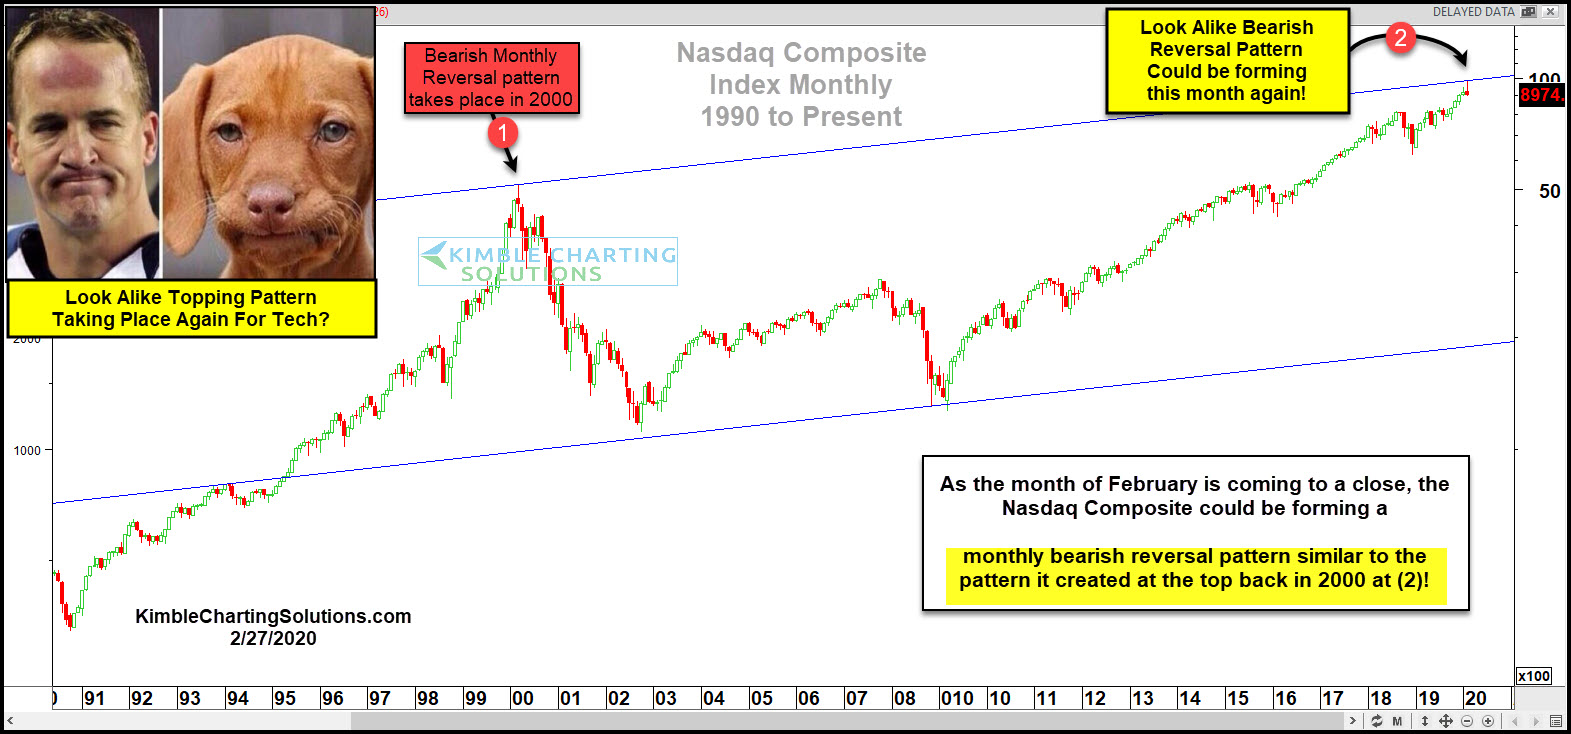
I am a fan of weekly charts over daily charts and monthly charts over weekly charts. As the month of February is nearing an end, the Nasdaq Composite could be creating a pattern that deserves a ton of attention!

This chart looks at the Nasdaq Composite Index over the past 30-years, on a monthly basis.

As we look back on this pattern, the Index created a bearish candlestick reversal pattern in March of 2000 at (1). This pattern reflected that buyer exhaustion was taking place after a 10-year run up in price. What a top this ended up being!

The Index has spent the majority of the past 20-years inside of this rising channel, with a double bottom/ higher lows taking place in 2002 and 2009, at the bottom of the channel.

The rally over the past 10-years has the index testing the top of this long-term rising channel.

As the month is coming to a close, I humbly feel it is important that we be aware that the Nasdaq Composite index, could be creating a “monthly bearish candlestick reversal pattern” at (2).

One month’s price action does not make a trend, nor prove that top similar to 2000 has taken place.

This monthly pattern does suggest that a buyer’s exhaustion point may have taken place within 1-month of the 20th anniversary of the Dot.com highs, at the top of a 20-year rising channel, after another 10-year sharp rally!

Latest comments

Is this a log chart?
Risk Disclosure: Trading in financial instruments and/or cryptocurrencies involves high risks including the risk of losing some, or all, of your investment amount, and may not be suitable for all investors. Prices of cryptocurrencies are extremely volatile and may be affected by external factors such as financial, regulatory or political events. Trading on margin increases the financial risks.
Before deciding to trade in financial instrument or cryptocurrencies you should be fully informed of the risks and costs associated with trading the financial markets, carefully consider your investment objectives, level of experience, and risk appetite, and seek professional advice where needed.
Fusion Media would like to remind you that the data contained in this website is not necessarily real-time nor accurate. The data and prices on the website are not necessarily provided by any market or exchange, but may be provided by market makers, and so prices may not be accurate and may differ from the actual price at any given market, meaning prices are indicative and not appropriate for trading purposes. Fusion Media and any provider of the data contained in this website will not accept liability for any loss or damage as a result of your trading, or your reliance on the information contained within this website.
It is prohibited to use, store, reproduce, display, modify, transmit or distribute the data contained in this website without the explicit prior written permission of Fusion Media and/or the data provider. All intellectual property rights are reserved by the providers and/or the exchange providing the data contained in this website.
Fusion Media may be compensated by the advertisers that appear on the website, based on your interaction with the advertisements or advertisers.
© 2007-2024 - Fusion Media Limited. All Rights Reserved.