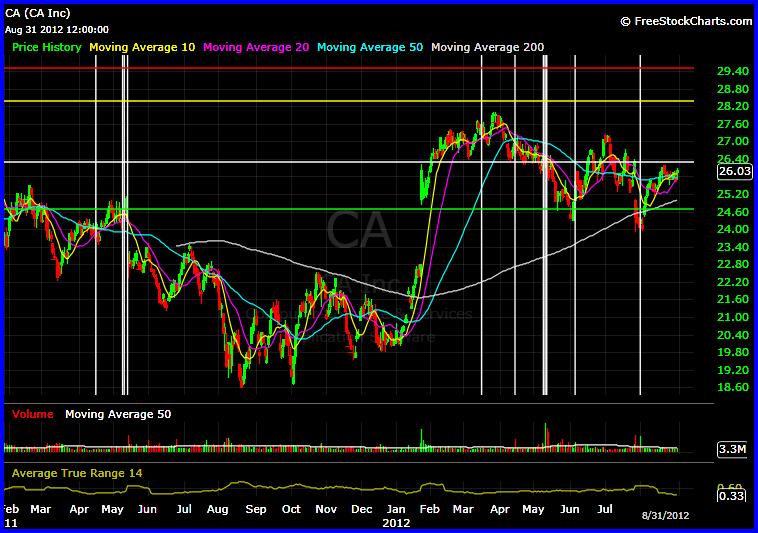
Since early January of this year, CA Technologies (CA) has been trading in a range bound sideways channel pattern, with a slight bias to the downside. Although CA Technologies is up 23.74 percent in the last 52 weeks, most (if not all) of that advance took place in January. In essence; the inventory objectives for the Designated Market Maker of this issue, were achieved in January. Therefore, this stock was going no higher over the last several months.
Even though CA Technologies did not advance further, there were several price swings of 10 percent or better since January. I suspect we will see this pattern continue. Since the current price level is closer to the ridgeline than the baseline, a pullback is imminent.
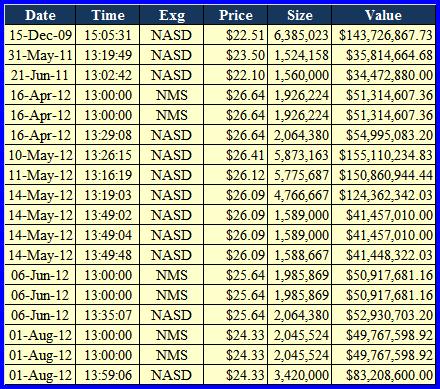
This is of course in conjunction with the blocks listed below: 
The technology sector has been performing nicely year over year — up 22.69%. Although I evaluate and make assessments of sectors, indices and the market as a whole, I do not put much emphasis on such groupings. I never execute a single trade or establish an investment posture, based solely on aggregate performance of an index or sector. I am far more interested in exploring the specific characteristics of the “merchandising process” for individual issues with a high degree of exactitude.
The most differentiating feature of this approach is that it defines each element as sharply and succinctly as possible, while eliminating hyperbole and ornamental flourishes of the critical narrative. This is how one transforms chance from a threat, to a positive force to be exploited.
Drafting a sensible plan for trading requires a full understanding of the structure and function of the market and the documented, as well as, the undocumented rules of engagement.
There is an extensive number of opposite or seemingly opposite concepts which need to be defined and compared not only to gain a truer understanding of each member of the pair; but also to trace the dynamic links that connect them to each other in a state of permanent interaction.
Purpose and means, strategy and tactics, theory and reality, intent and execution, long and short, greed and fear, risk and reward – to mention but a few parings, which are never absolute opposites but rather flow into each other. What is more, every time you add a new variable into the mix you change relationships exponentially.
Theory only offers traders points of reference and standards of evaluation in specific areas of action. Its ultimate purpose is not to instruct us as traders how to act under certain circumstances, but to develop our judgments about those circumstances. A trader wishing to understand the nature of the market and the nature of trading must focus his attention and energies on (3) central concepts:
- The market is not an auction market as much as it is a merchandising enterprise;
- Aggregate volume and large blocks are the precursors to price movement;
- It is rising prices that create demand.
In addition to absolute events which give impetus to price action, there are other more abstract factors which weigh in the overall balance. Yet, they can never truly be measured. I refer to the psychology of the market. There is nothing new about stressing the significance of psychological factors in trading. Many writers focus on the two most recognized emotions which are greed and fear. Perhaps this is because each of us knows instinctively what they are in their entirety. Suffice it to say that both ordinary and exceptional traders fall victim to each at one point or another.
The ability to trade successfully comes from making correct assessments through observations, historical interpretations and speculative reasoning while being in the triangular crossfire of market forces. It is these interactions which dominate the chaos of trading. Strategy comprises not only the statistics of events which are accommodative to mathematical analysis such as volume and volatility (or lack thereof), it also extends to wherever our intelligence and or flashes of intuition discover a resource that can serve us as traders.
The Blocks in the block data matrix provided have been indexed in the chart with white vertical lines. You can surmise from their position, these blocks are indicative of serious Designated Market Maker merchandising. The blocks of August 1 all traded at exactly the same price and are reported (but not necessarily traded) after the close. They could all be viewed as a single block, which gives rise to their level of importance.
Those of you who have read The Stock Market Insiders Manifesto should understand the importance of these trades.
On the basis of the foregoing, these are my views and observations:
The Trade:
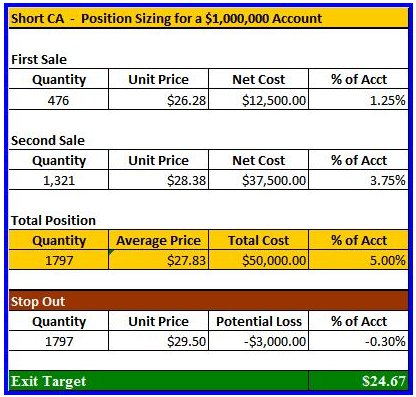
I recommend establishing a short position in CA Inc. Open your short position (First Sell) with only ¼ of whatever capital you intend to commit to CA Inc., at $26.28 or better. Cost Average (Second Sell) the remaining ¾ of the position at $28.38 and stop out at $29.50. Do not post your stop loss. I have said it before but it is so important that at the risk of being redundant and in an abundance of caution I will say it again. It is too easy for the Designated Market Maker to cash investors out by moving the price above or below your stop out and move the price right back up or down again. In addition, when a stop out is triggered it converts into a market order and that could be disastrous if the DMM decides to really take advantage. Remember the “Flash Crash“? I would be looking to cover this position with a downside price target of $24.67.
There is always the possibility that the trade may not work out.
There Is Never A Sure Thing (particularly on a short)
Investors must realize and recognize that there is never a sure thing. Sometimes events that have a low probability of occurring bring forth very serious consequences should they come into being. Investors must judiciously consider what the inherent practical limits are and how much they stand to gain in relation to the risks involved in establishing any position.
In addition, persistence can become desperate folly by allowing a losing position to become a viable argument for deciding on a new position. Rather, such decisions should be based on the current and soon-to-be circumstances.
Any position in which one unexpected factor has a significant impact on your portfolio is the result of poor planning. It is a fault most commonly associated with people who want to explain away their losses. SUN TZU – Art of War “Use an attack to exploit a victory, never use an attack to rescue a defeat.”
If you follow the process recommended and the trade does not work, the overall loss in this model is $3,000.00. That amounts to .003 of the overall portfolio (theoretically valued at $1,000,000).
Finally, never be a brave and brainless investor because a fool and his money are soon parted.
A portfolio of $1,000,000 should position size in the following manner: 
This is a trade, not an investment. Be ever vigilant.
Disclosure: This is a trade, not an investment. Be ever vigilant. See Performance Tracking here.
