
Murphy USA Inc.'s (NYSE:MUSA) share price hit a new 52-week high of $121.12 during the trading session on Nov 6. As a matter of fact, the stock has surged nearly 23% since its third-quarter earnings announcement on Oct 30.
The motor fuel retailer’s strong third-quarter earnings and investor optimism, backed by healthy fuel margins, prompted the rally.

What Did Murphy USA’s Earnings Unveil?
Murphy USA reported third-quarter 2019 earnings per share of $2.55, comprehensively beating the Zacks Consensus Estimate of $1.51 and the year-ago period profit of $1.38. The strength in bottom line could be attributed to robust retail gallons and same-store sales (SSS) volumes, which rose 5.3% and 2.7% year over year, respectively.
Murphy USA’s operating revenues of $3.7 billion fell 3.4% year over year and missed the Zacks Consensus Estimate by $44 million, hurt by lower retail gasoline prices. Average retail gasoline prices during the quarter were $2.38 per gallon, down from $2.61 per gallon a year ago.
Revenues from petroleum product sales came in at $3 billion, down 5.9% from the third quarter of 2018 and below the Zacks Consensus Estimate of $3.3 billion. However, merchandise sales, at $681.1 million bettered the consensus estimate of $666 million and rose 9.2% year over year.
Murphy USA Inc. Price, Consensus and EPS Surprise
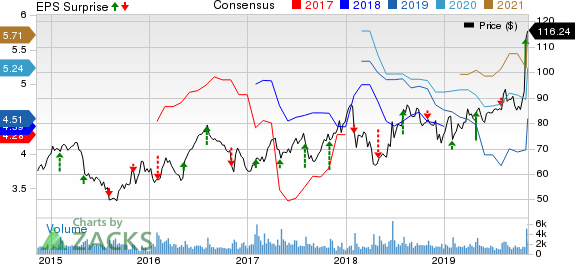
Murphy USA Inc. price-consensus-eps-surprise-chart | Murphy USA Inc. Quote
Key Takeaways
The company’s total fuel contribution was up 30.6% year over year to $225.6 million, driven by volume and margin expansion. Total fuel contribution (including retail fuel margin plus product supply and wholesale results) came in at 20.1 cents per gallon, improving from 16.2 cents per gallon in the third quarter of 2018.
Retail fuel contribution rose 36.3% year over year to $206.4 million as margins increased to 18.4 cents per gallon (from 14.2 cents in the corresponding period of 2018). Retail gallons were up 5.3% from the year-ago period to 1,120.6 million in the quarter under review. Volumes on an SSS basis (or, fuel gallons per month) rose 2.7% from the third quarter of 2018.
Contribution from Merchandise increased 6.4% to $111.2 million on higher sales and strong performance from new stores even as unit margins, at 16.3%, fell from the year-ago period’s 16.8%. On SSS basis, total merchandise contribution was up 5.3% year over year in the quarter under review on the back of higher tobacco margins that increased 10.8%. Meanwhile, merchandise sales rose 7.2% on SSS basis.
Fuel gallons rose 3.6% and merchandise sales increased 7.4% on average per store month (or APSM) basis.
Balance Sheet
As of Sep 30, Murphy USA — which opened five new retail location to bringing its store count to 1,479 — had cash and cash equivalents of $247.7 million, and long-term debt (including lease obligations) of $966.4 million, with a debt-to-capitalization ratio of 55.4%.
During the quarter, the company bought back shares worth $109 million.
Zacks Rank & Key Picks
Murphy USA, which came into existence following the 2013 spin-off of Murphy Oil Corporation’s (NYSE:MUR) downstream business into a separate, independent and publicly-traded entity, holds a Zacks Rank #2 (Buy).
Apart from Murphy USA, investors interested in the energy space might look at other options like Phillips 66 (NYSE:PSX) and SilverBow Resources, Inc. (NYSE:SBOW) that also sport a Zacks Rank #2. You can see the complete list of today’s Zacks #1 Rank (Strong Buy) stocks here.
Phillips 66 has seen the Zacks Consensus Estimate for 2019 rise 13.8% over 30 days.
SilverBow Resources has seen the Zacks Consensus Estimate for 2019 rise 2.8% over 30 days.
Today's Best Stocks from Zacks
Would you like to see the updated picks from our best market-beating strategies? From 2017 through 2018, while the S&P 500 gained +15.8%, five of our screens returned +38.0%, +61.3%, +61.6%, +68.1%, and +98.3%.
This outperformance has not just been a recent phenomenon. From 2000 – 2018, while the S&P averaged +4.8% per year, our top strategies averaged up to +56.2% per year.
Murphy USA Inc. (MUSA): Free Stock Analysis Report
Phillips 66 (PSX): Free Stock Analysis Report
Murphy Oil Corporation (MUR): Free Stock Analysis Report
SilverBow Resources Inc. (SBOW): Free Stock Analysis Report
Original post
Zacks Investment Research