A perceived drop in North Korea threats and some weak data from China and Europe was all the excuse that stale crude oil and gold longs needed to head for the exit door.
Crude Oil
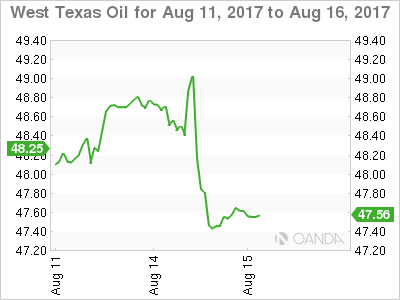
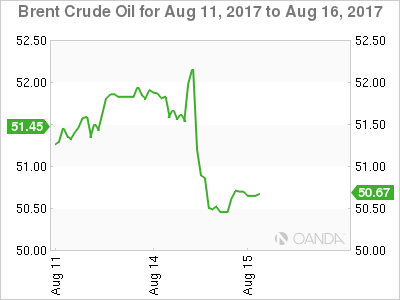
Crude oil prices tumbled overnight with both Brent and WTI spot falling some 2.60 % to close at their lows at 50.50 and 47.45 respectively. Numerous factors came together during the New York session to put the knife into oil and then twist it. A decrease in North Korea tension certainly helped along with weaker China and European data. It saw the U.S. dollar strengthen in general across the markets.
The EIA also adjusted its forecasts higher for U.S. shale production, but the cynic in me regards the backward looking Commitment of Traders (COT) report as the primary driver. Although a week out of date it showed that speculative traders (mostly hedge funds) had become firmly bullish on oil again. This fits perfectly with my comments in previous reports that stale speculative long positioning and a reluctance to hold unprofitable positions has been the main force behind the oil rally running out of steam over the last few sessions. Simply put, speculators have been long and wrong at unattractive levels.
WTI
Of the two contracts, WTI spot is looking the more vulnerable technically as it trades at 47.60 in early Asia. It broke and closed below its 100-day moving average overnight at 47.85, and this forms initial resistance followed by 48.25. A break of initial support at the overnight low of 47.30 sets the scene for a much deeper washout to possibly the 46.00 and 45.00 regions.

Brent
Brent spot is trading at 50.65 and clinging to its support at the 100-day average just below at 50.50. Resistance rests at 51.00 intraday. A break of 50.50 sets up a possible technical correction to support at 49.70.

Gold
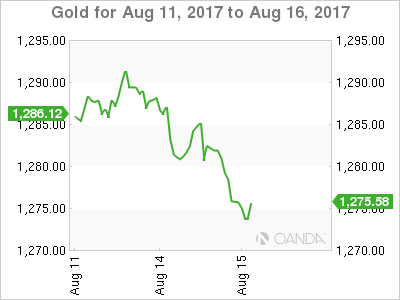
Gold fell seven dollars to 1275.00 overnight as a resurgent U.S. dollar weighed upon precious metals. Weaker China and European data and a lack of chest thumping from North Korea diminished the safe haven appeal of gold following the weekend. We suspect the lull is only temporary however and gold will continue to be supported on meaningful dips.
This morning gold continues to hover around 1275.50, just above initial support at 1275.00. A daily close below here may imply a deeper correction to 1260.00 is on the cards. However, longer term bulls will only get concerned should the 100-day moving average at 1254.85 break.
Resistance lies at 1282.00 initially ahead of 1292.50 and then the formidable 1296.00 region which must break and consolidate before we can start talking about a structural move onto a 1300 handle.

