KEY DATA RELEASES TODAY (BST) :
12:00 GBP Official Bank Rate 0.50% v 0.50%
12:00 GBP Asset Purchase Facility 375B v 375B
12:03 GBP MPC Rate Statement
OVERNIGHT:
EUR/USD weighed on into the back end of last week by the decline in EUR/GBP as the pound strengthened against the euro after the election win by Cameron’s Conservative Party. Greece’s finance ministry working group is preparing growth plan for post-bailout era, which is a long-term plan and beyond Brussels Group negotiations, according to Greece’s Finance Ministry ahead of today’s Euro Group meetings in Brussels.
GBP/USD surged the most in three and a half years against the euro and strengthened against most major peers as the surprising result of the nation’s general election. Cameron’s Conservative Party won the majority of the seats and hence can ditch their Liberal Democrat coalition partners and govern alone in the 650-seat parliament. Eyes turn to the BOE’s MPC announcement with no change expected today.
USD/JPY traded in a tight range between 119.60 and 120.23, and closed at 119.79, nearly the same as previous close. Bank of Japan’s minutes showed that policy board members shared the recognition that inflation expectations appeared to be rising on the whole from a longer-term perspective, worth noting there are 2.2Bln worth of expiries at 120 for the NY cut today interbank reports suggest large Japanese exporters raised there offers to above 120 with importer bids noted around 119.50
PRICE ACTION OVERVIEW:
EUR: 1.1160/40 bids being tested, while intraday upside reaction are capped by the 1.1230/60 area expect further pull back to test the 1.10 base
GBP: 1.55 broken en route to 1.5560 key resistance expect offers on first test only below 1.5350/30 concerns immediate bullish bias
JPY: Retesting 120 descending trendline resistance offers a break and close above 120.50 opens April highs
CAD: While 120.50 supports on an intraday basis expect test of 122 enroute to 123/124
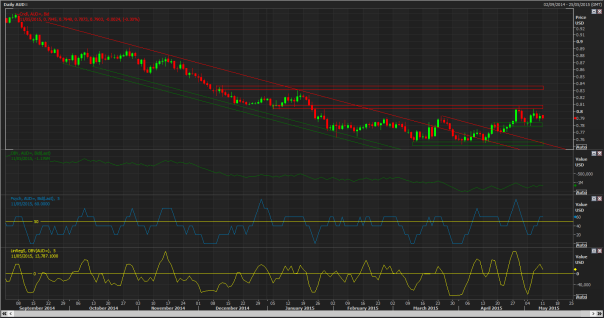
AUD: 8050 offers cap upside for a second time while .78 supports potential for another run at .8050, below .78 concerns near term bullish bias
KEY TRADES:
| FX Pair | Short Term | Position/Date | Entry Level | Target | Stop | Comments |
| EUR/USD | Neutral | Await new signal | ||||
| GBP/USD | Bullish | Await new signal | ||||
| USD/JPY | Neutral | Await new signal | ||||
| USD/CAD | Neutral | Await new signal | ||||
| AUD/USD | Neutral | Await new signal |
ANALYSIS:
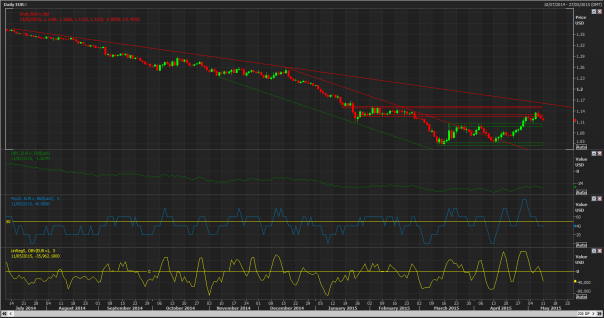
EUR/USD Short Term (1-3 Days): Neutral – Medium Term (1-3 Weeks) Bearish
- 1.1160/40 bids being tested, while intraday upside reaction are capped by the 1.1230/60 area expect further pull back to test the 1.10 base
- Order Flow indicators; OBV ticking down, Linear Regression and Psychology pierce midpoints from above
- Monitoring price action and Order Flow indicators to set shorts against last weeks highs
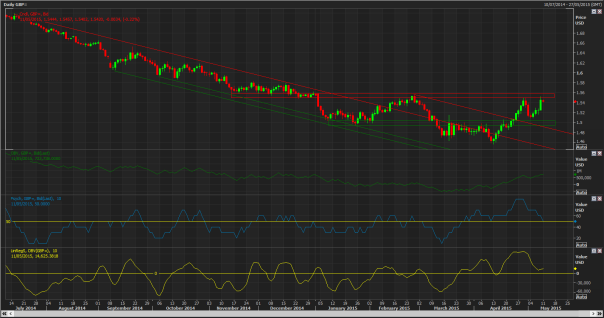
GBP/USD: Short Term (1-3 Days): Bullish – Medium Term (1-3 Weeks) Bearish
- 1.55 broken en route to 1.5560 key resistance expect offers on first test only below 1.5350/30 concerns immediate bullish bias, while 1.56 caps expect reaction lower to retest 1.51/1.50 base, a close above 1.56 targets 1.58 next
- Order Flow indicators; OBV consolidates recent gains, Linear Regression and Psychology bullish but rolling over to retest midpoints from above
- Monitoring price action and Order Flow for shorts targeting 1.45 initially and 1.42 in extension against 1.56
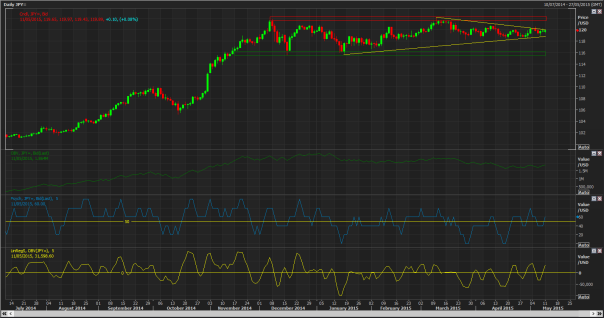
USD/JPY: Short Term (1-3 Days): Neutral – Medium Term (1-3 Weeks) Bullish
- Continued retest of 120 descending trendline resistance offers a break and close above 120.50 opens April highs, failure at near term 119.50 support suggests another retreat back to range lows.
- Order Flow indicators; OBV ticking up, Linear Regression and Psychology pierce midpoints from below
- Monitoring price action and Order Flow indicators to set longs against 118 targeting 124
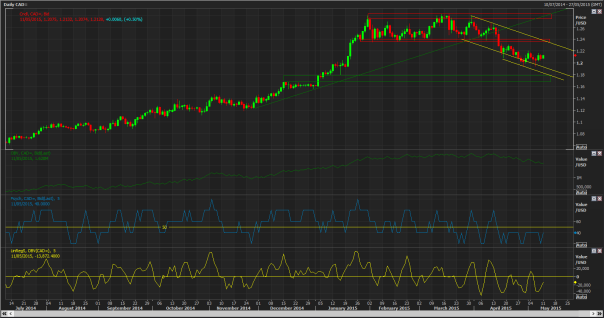
USD/CAD: Short Term (1-3 Days): Neutral – Medium Term (1-3 Weeks) Bullish
- While 120.50 supports on an intraday basis expect test of 122 enroute to 123/124. A break of 120 pivotal support targets 118 next
- Daily Order Flow indicators; OBV sideways, Linear Regression and Psychology bearish but ticking up to attempt midpoint test form below
- Monitoring price action and Order Flow indicators on retest of 123/124
AUD/USD: Short Term (1-3 Days): Neutral – Medium Term (1-3 Weeks) Bearish
- 8050 offers cap upside for a second time while .78 supports potential for another run at .8050, below .78 concerns near term bullish bias
- Order Flow indicators; OBV ticking down, Linear Regression and Psychology pierce midpoints from below but lack upside momentum
- Monitoring price action and Order Flow indicators to set shorts targeting .72 against .8050
