
WTI surged to close at $56.01 a barrel on Wednesday, while Brent closed at $62.86 after the US crude oil inventories showed a 'less-than-expected increase'. The latest weekly inventory (week ending April 10) from EIA showed an increase of 1.3 million barrels, much less than the 10.9 million barrels of build from the previous week. The report also showed that total motor gasoline inventories decreased by 2.1 million barrels, while distillate stockpiles rose by 2.0 million barrels.

Shale Output To See Its First Decline in 4 YearsInventory Build Is A Buy Signal?
I'm not sure exactly when and how market players started equating a 'less-than-expected oil inventory build' with a buy signal. This to me merely suggests a slowdown of crude oil production increase, hardly a reason to buy up the market.
Furthermore, the inventory build in distillate, which is used primarily in industrial activities, seems like a sign of weaker broader U.S. economy, which could mean the gasoline inventory would start to build again.
Indeed, the U.S. shale oil industry is starting to feel the pinch from lower oil price, down ~60% since 2H14. Another EIA report already predicted U.S. shale will see its first monthly production drop in 4 years this May.
Among the five major U.S. shale oil regions, the Niobrara formation, northeast of Denver CO, will lead the month-over-month decline, followed by the Eagle Ford shale in Texas and the Bakken formation in North Dakota, while output from the Permian in Texas and the Utica in Ohio is expected to rise in May.
Oil rig count has been dropping like a rock since 2H14 when oil market turned bearish , and it looks like well inventory has been sufficiently depleted to finally make a dent on production.
% Change Since January 3, 2014
 |
| Chart Source: BofA via Business Insider, April 14, 2015 |
Shale Drillers Are More Resilient Than Expected
However, the advance in oilfield and oil and gas upstream technology has brought tremendous increase in productivity and efficiency in the U.S. shale industry, which means shale drillers, now in survival mode, are more resilient than most people (including Saudi) originally thought. If oil prices stabilize at or above current levels, expect drillers to move in again, rig count and production would quickly recover.
OPEC Still Flooding The Market
So overall, the signs are mixed in the U.S. oil market. Outside of U.S., geopolitical tension is still high in the Middle East -- escalating fighting in Yemen, and Iran nuclear deal is still pending. Meanwhile, almost like repenting the oil geopolitical premium put on by a Saudi-led campaign of air strikes against Iran-allied Houthi rebels at Yemen, OPEC pumped 31.02 million barrels per day in March, near a two-year high, pressuring any positive sign from demand or anywhere, for that matter. In a way, Saudi is trying to delay or put a stop to the ongoing energy switch and substitute due to decades of high oil prices.
Iran Could Replace U.S. Shale Cutback
The production cutback by U.S. shale could be interpreted as a positive sign for oil prices in the short term, but the loss from U.S. shale could easily be offset by the increase in Iranian oil export since Iran nuclear deal is expected to have a formalized plan by mid-year.
China Sputters
For the longest time, China's has been one popular excuse cited by Oil Bulls. Yes, China was on its way to replace the U.S. as the world's largest oil consuming nation, but the growth engine is now sputtering. This was confirmed when China saw its economic growth slow to 1.3% in 1Q15, compared with growth of 1.5% in the previous three quarters.
$900 Bn Wealth Transfer by Cheap Oil
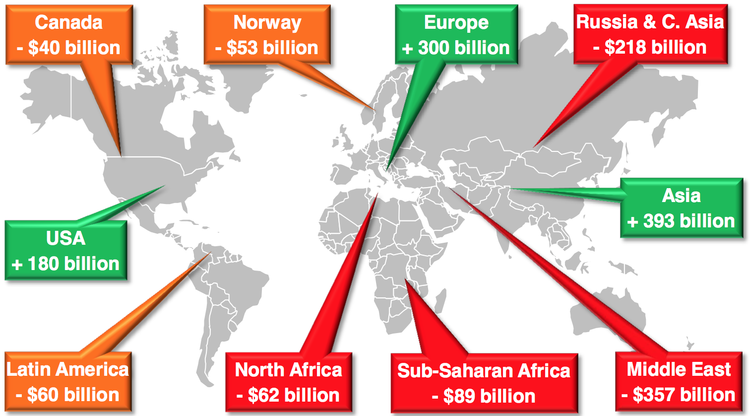 |
Lower energy prices means lower energy costs for the net oil importing countries while many oil exporting countries inside and outside OPEC are hurting. The IMF estimated in December that the oil price crash could bring in 0.7% GDP growth worldwide. Bloomberg crunched the numbers and came up with a map (above) so we know who gets what and how much. According to
Net oil importers like the U.S., Europe, and Asia are getting a nearly $900 billion economic stimulus from cheaper oil prices. The Middle East and Russia are the ones getting stuck with the bill.
In other words, cheaper oil has initiated a wealth transfer effect of about $900 billion a year between net oil importers and oil exporters reversing decades of historical trend. The U.S. along gets $180 billion, and Europe and Asia (i.e. China) are even bigger beneficiaries of this wealth transfer by cheap oil.
Lower for Longer?
So in the grand scheme of things, I agree that oil prices, just like rig count, should become 'lower for longer" until a supply or demand shock triggered by, for example, another financial crisis, or shale oil becomes depleted / dried-up (shale typically has accelerated declining production curve, so this scenario is quite plausible). Nevertheless, the wild card would be the OPEC meeting this June amid mounting pressures from some OPEC members for some kind of coordinated production cut.