Monitoring purposes S&P 500; Short S&P 500 on close (4/29/15) at 2106.85.
Monitoring purposes Gold: Flat.
Long Term Trend monitor purposes: Flat

Timers Digest ranked the Ord Oracle #6 in performance for 3 months updated March 9, 2015.
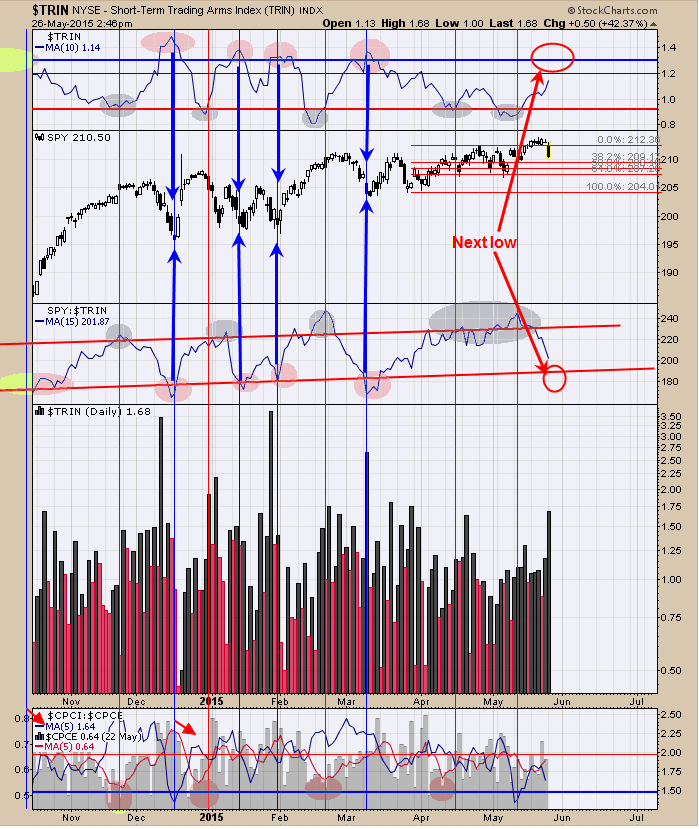
The top window is the 10 day average of the TRIN. It common for bottom to form in the market when the 10 day average of the TRIN is above 1.30. Current reading is coming in at 1.14. The window below the SPY chart is the SPY/TRIN ratio with a 15 period moving average. Short term lows have formed when the SPY/TRIN ratio reaches below the lower red boundary line (which has not been reached yet). It has been a reliable signal for a low when both the 10 day TRIN is above 1.30 and the SPY/TRIN ratio below the lower boundary line. We have identified previous instances with blue arrows on the chart above. The bottom window is equity put/call ratio and when this ratio is above .67 (left hand reading) the market is usually near a low. Current reading is .63. We are short the S&P 500 on 4/29/15 at 2106.85.

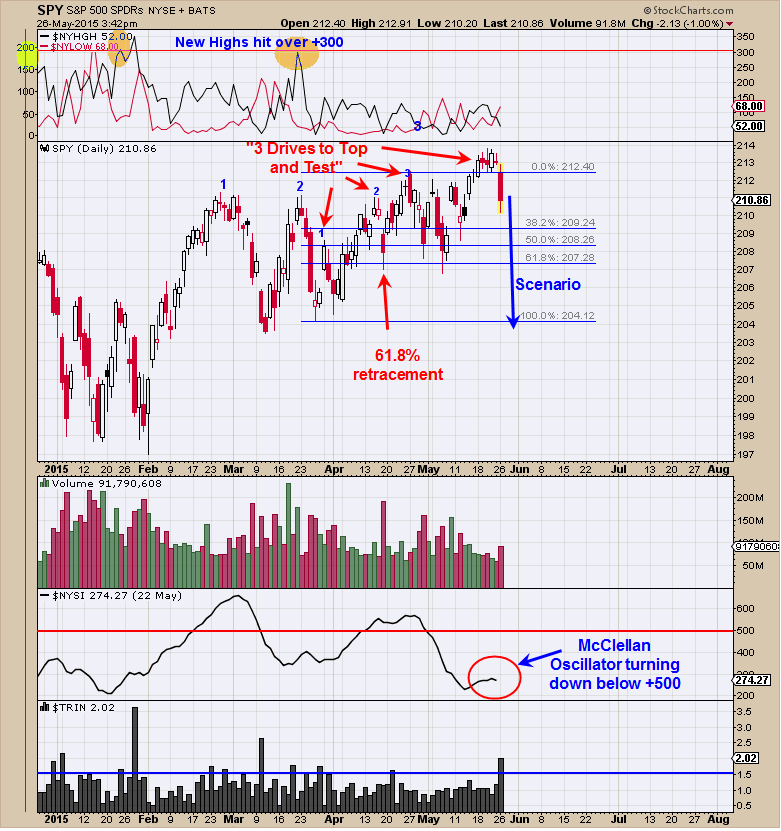
A couple of weeks ago, we pointed out the possibility that a “Three Drives to Top” may be forming and that idea is still alive. The recent new high saw last week is the “Three Drives To Top” test. “Three Drives to Top” can be identified by the pull back off of the second high which should be at least a 61.8% retracement of the previous up-leg (which this one was). Market then rallies to new high and third top. Sometimes the “Third top” is tested which is what has happen here. A “Three Drives to Top” has a minimum down side target to where the pattern began and in this case would be a price target near 204 on the SPY. The second window up from the bottom is the NYSE McClellan Summation index. The worst declines in the market have occurred when McClellan Summation index turns down from below +500 (current reading is 274.27) and it appears it has turned down. The TRIN closed at 2.20 and the TICKS closed at -433 and both are panic readings. Sometimes at tops panic readings are recorded, but another set of panic readings will suggests a bottom is near.

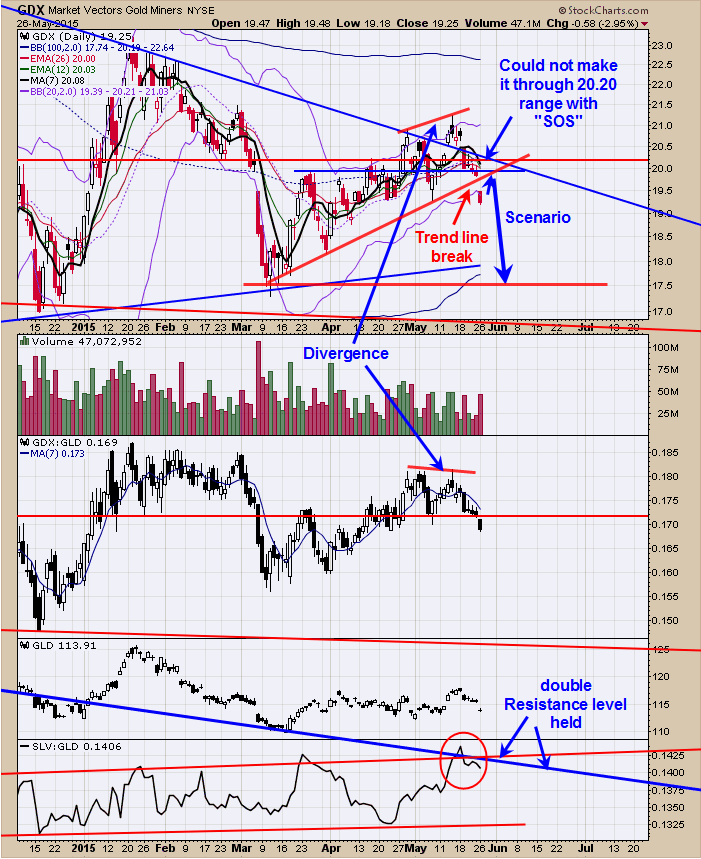
The bottom window is the silver/gold ratio expressed in ETF terms of slv/gld. It appears the double resistance line (the red and blue lines) held and turns this ratio back down and a short term bearish divergence. The GDX/GLD ratio did show a minor divergence in late April and early May and a short term bearish sign. Market Vectors Gold Miners (ARCA:GDX) did try and break through the 20.20 range and spent time on failed rallies and failed declines and finally today did break through the uptrend line with a gap down and a confirmed break. A possible rally back to the trend line is possible near 20 resistance before resuming to a possible downside target near 17.50 range. We will see how the gap is tested near 20. Staying neutral for now.
