Further to my last Weekly Market Update and its subsequent Addendum, this week's update will look at:
- 6 Major Indices
- 9 Major Sectors
- Number of Stocks Above 20/50/200-Day Moving Averages
- Various World Markets
- N.B. Please click this link to see my Addendum post to this one for further Weekly analysis
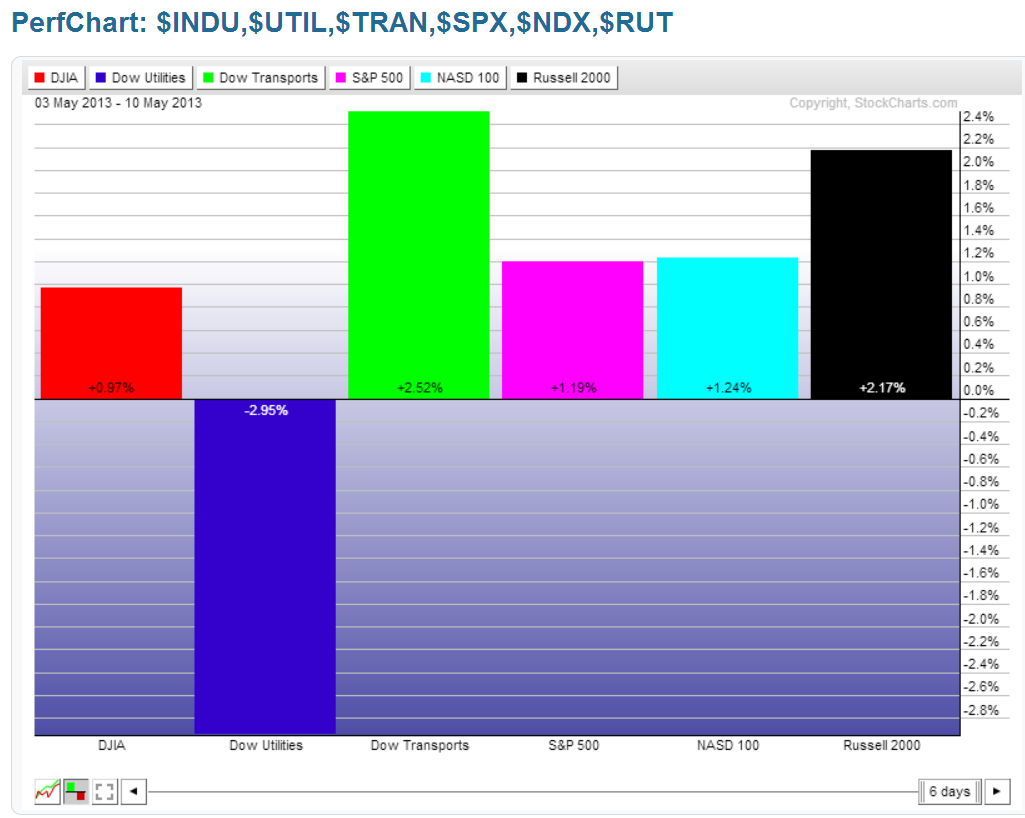
As shown on the Weekly charts and the percentage gained/lost graph below of the Major Indices, the largest gains were made in the Dow Transports, followed by the Russell 2000, Nasdaq 100, S&P 500, and the Dow 30. In continuing last week's theme, there was more profit-taking in the Dow Utilities.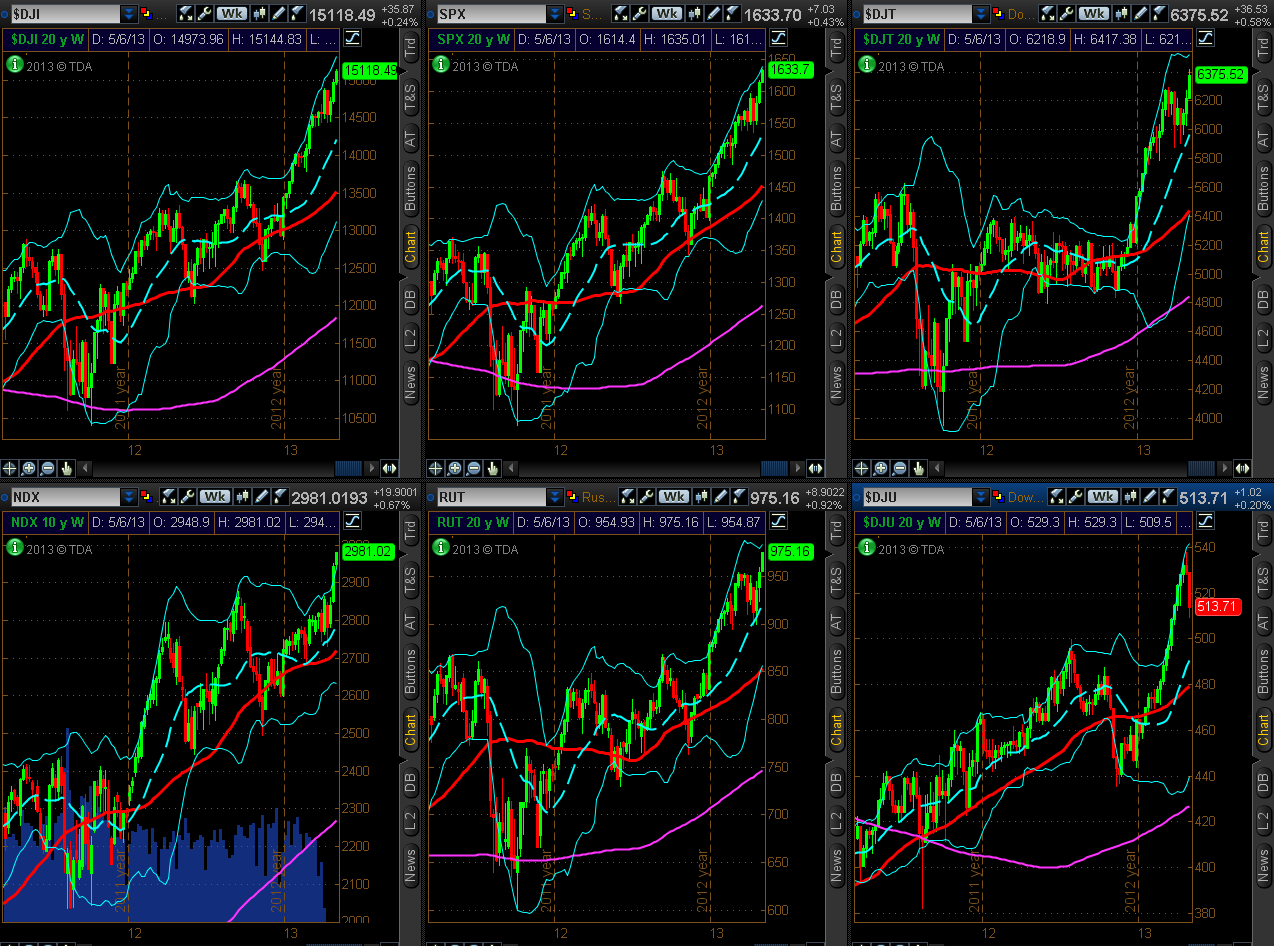
9 Major Sectors
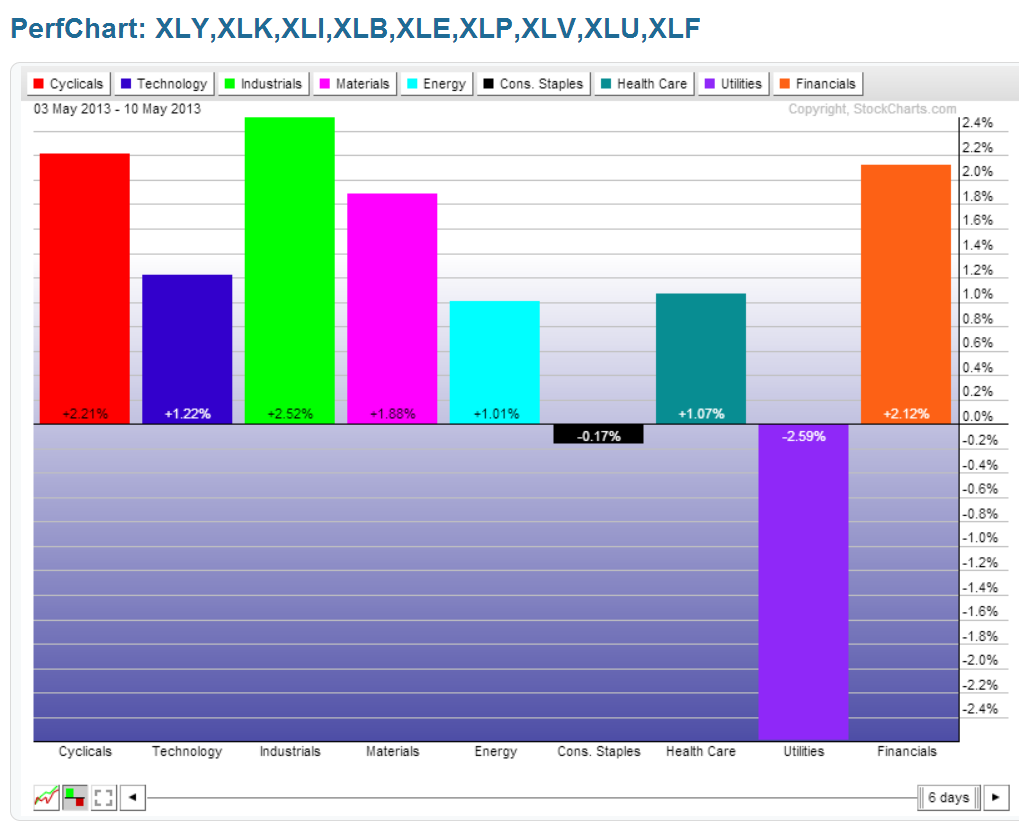
As shown on the Weekly charts and the percentage gained/lost graph below of the Major Sectors, the largest gains were made in Industrials, followed by Cyclicals, Financials, Materials, Technology, Health Care, and Energy. Consumer Staples were basically flat, and further profits were taken in Utilities.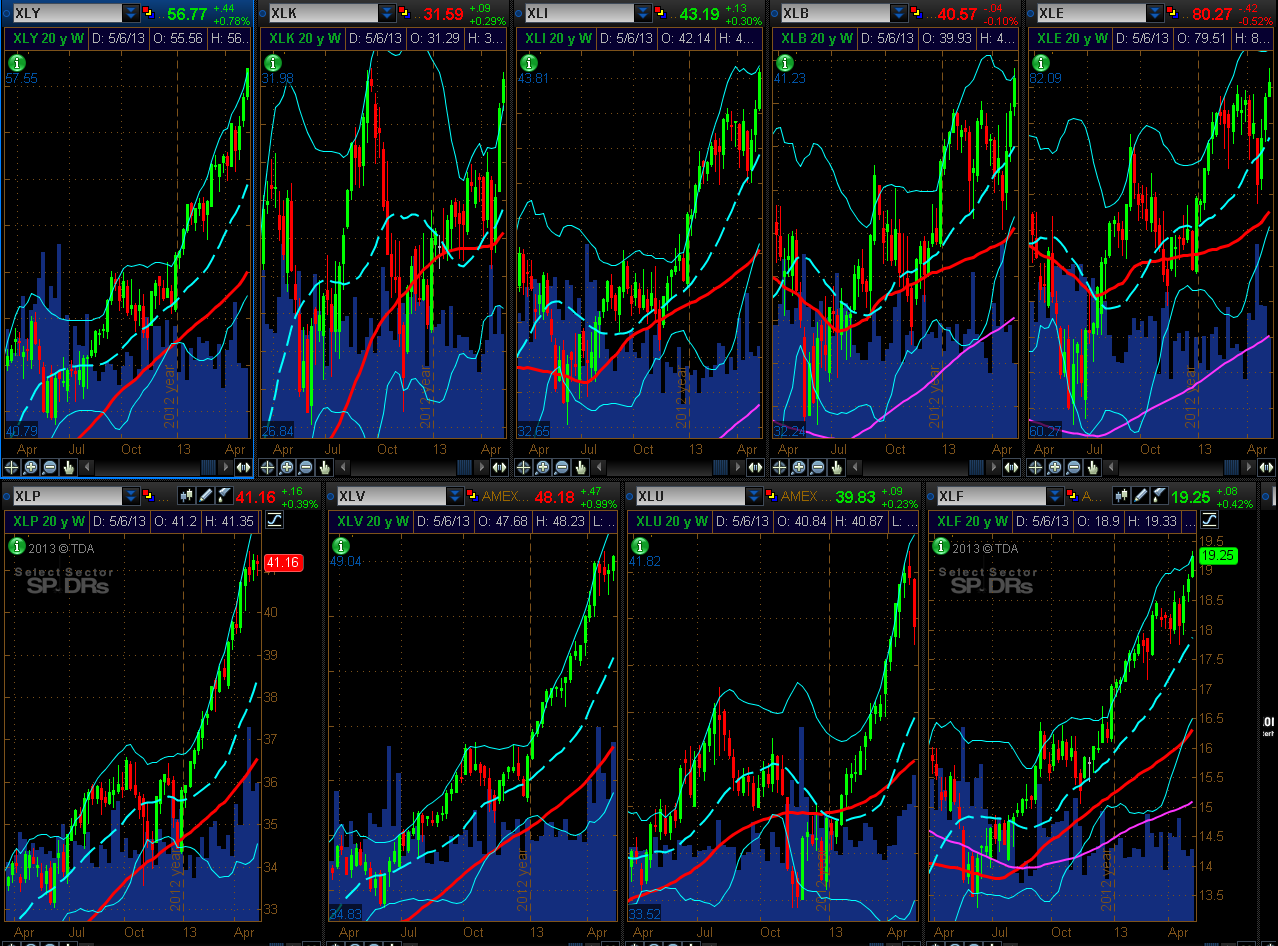
Number of Stocks Above 20/50/200-Day Moving Averages
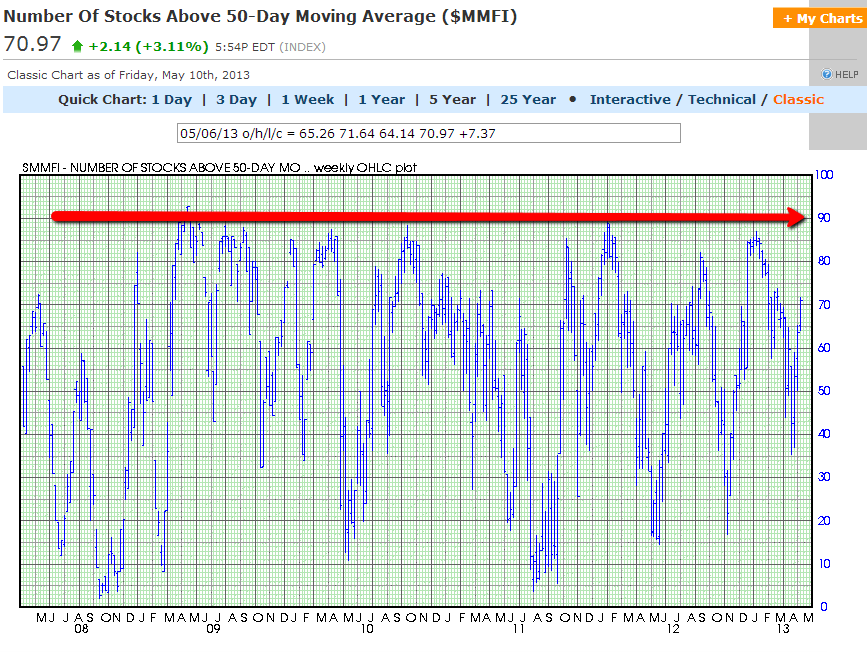
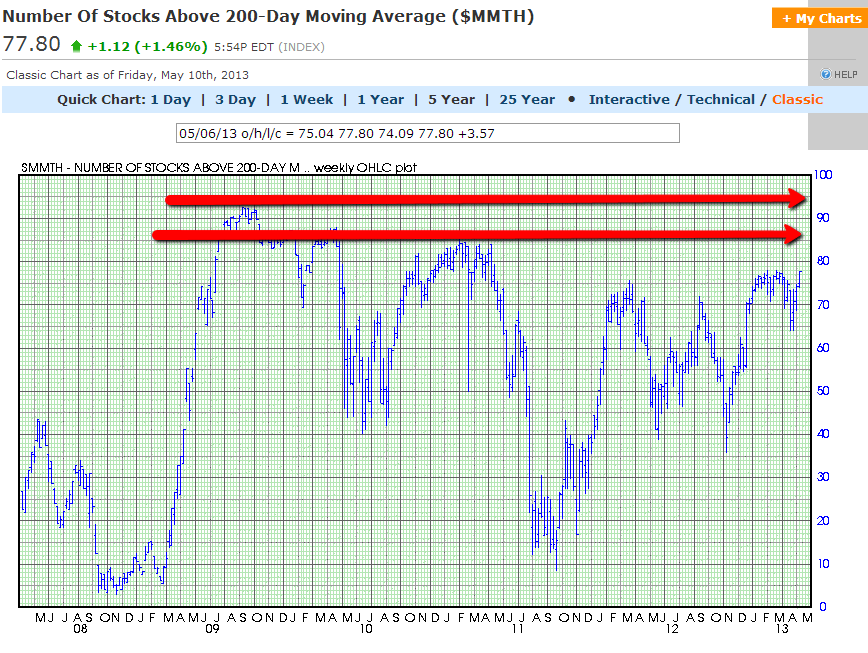
Below are three 5-Year Weekly charts showing the number of stocks (on a percentage basis) above 20/50/200-Day moving averages.
You can see from the first two charts that, on a short-term and medium-term basis, stocks only have a short way to go before they hit their major resistance levels. However, the last chart shows that, on a long-term basis, stocks have already hit a minor resistance level (established this year), and are approaching major resistance levels (established in 2009 and 2010).
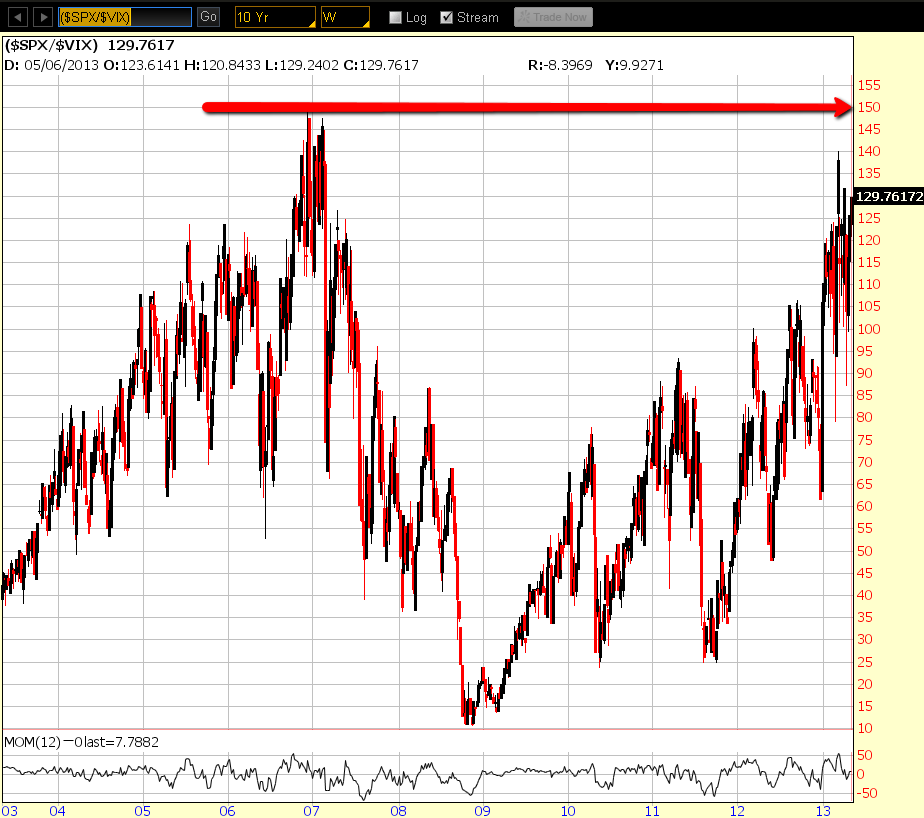
With such exuberance as is being displayed in a variety of markets around the world (supported by various Central Bank quantitative easing programs), we may very well see stocks continue to push up, generally speaking, until these major resistance levels have been reached. Such an occasion may occur when (and if) the SPX:VIX ratio hits its all-time major resistance level of 150.00 (established right before the financial crisis), as shown on the next 10-Year Weekly ratio chart.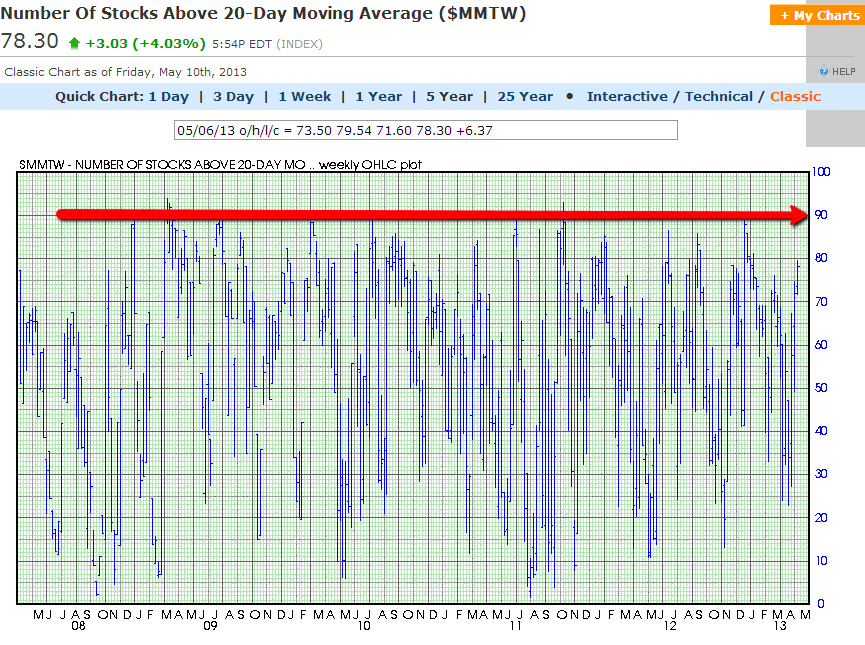
Various World Markets
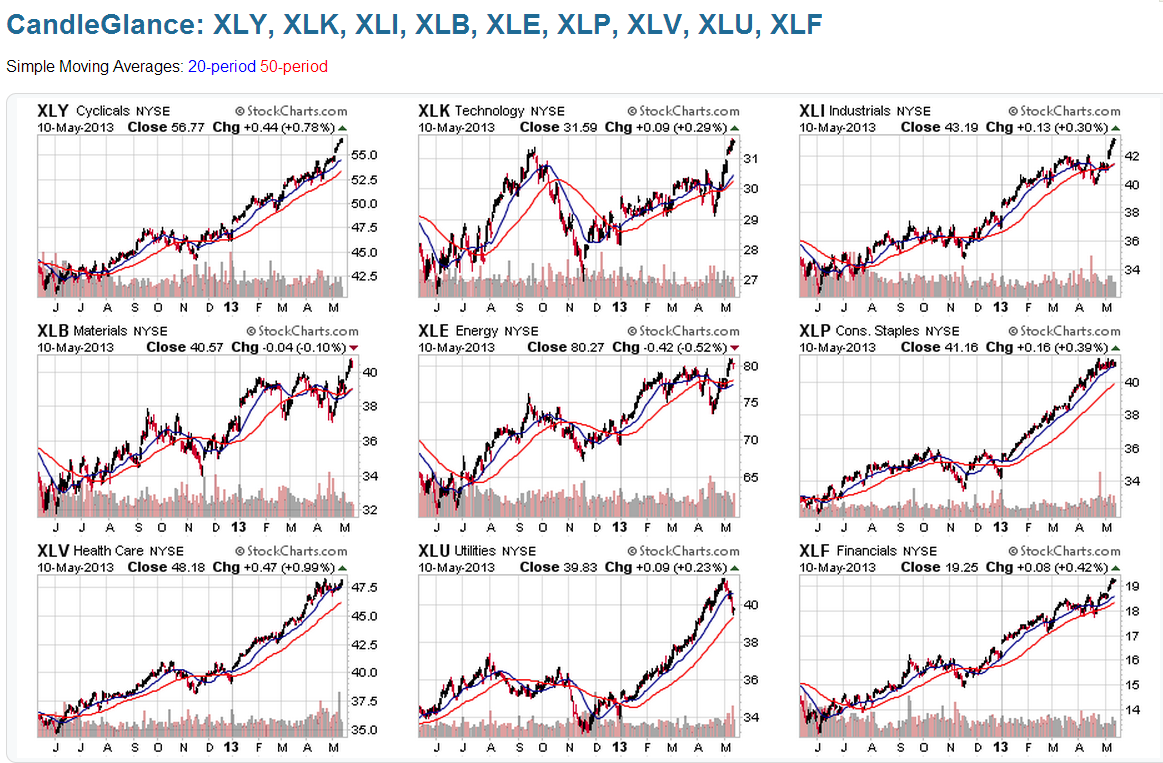
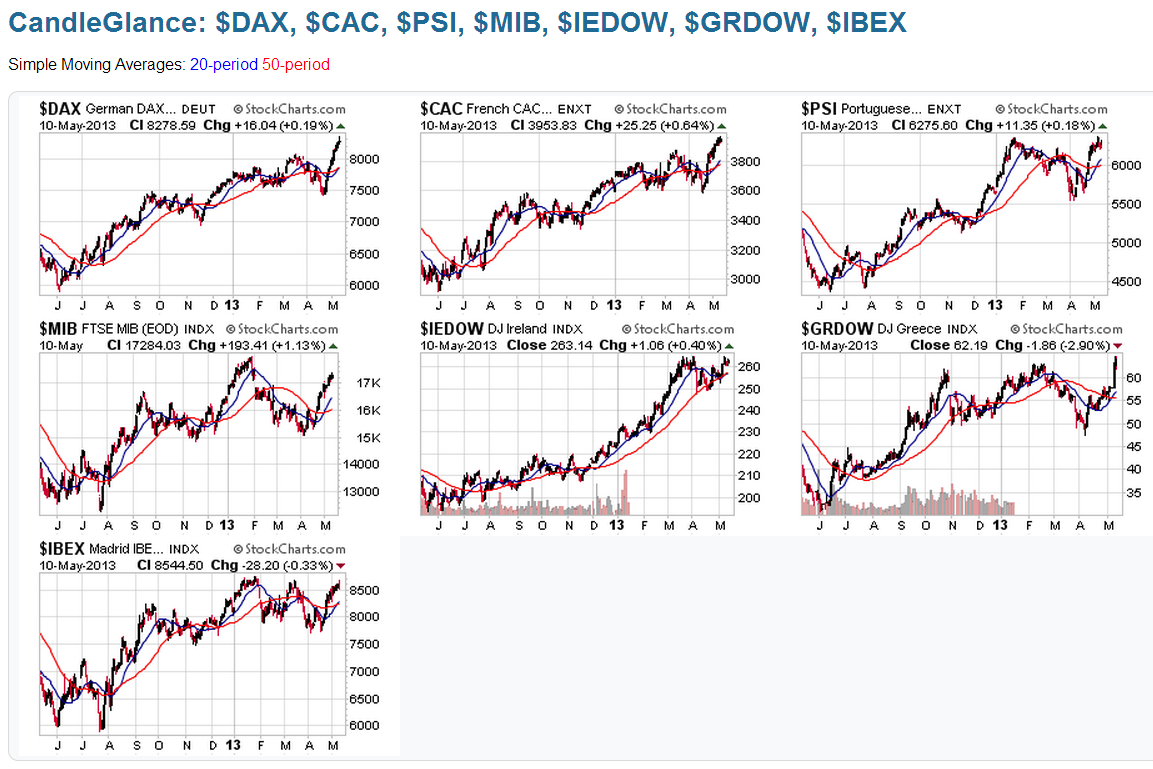
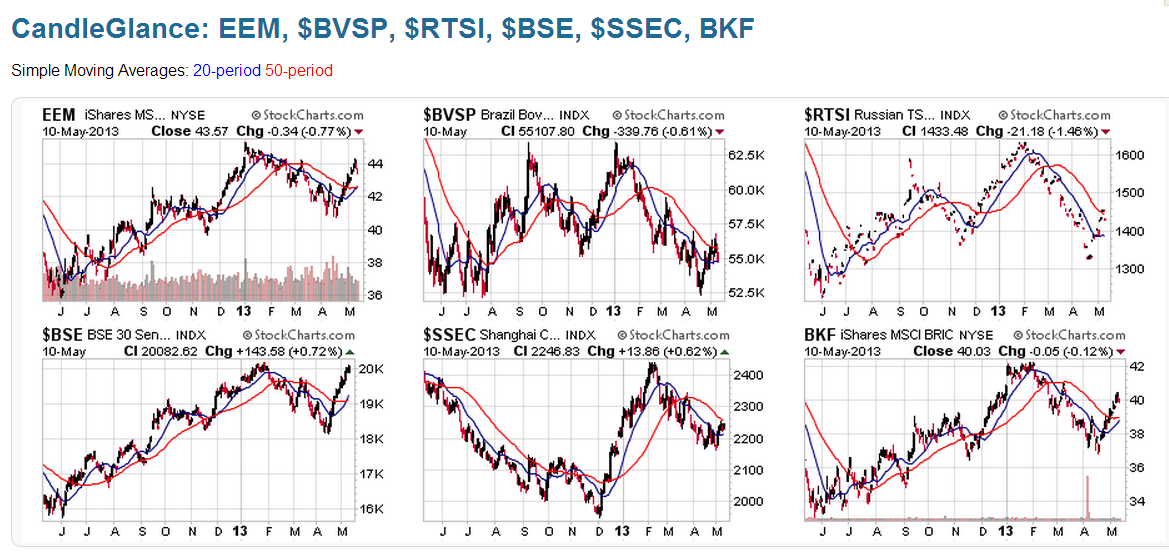
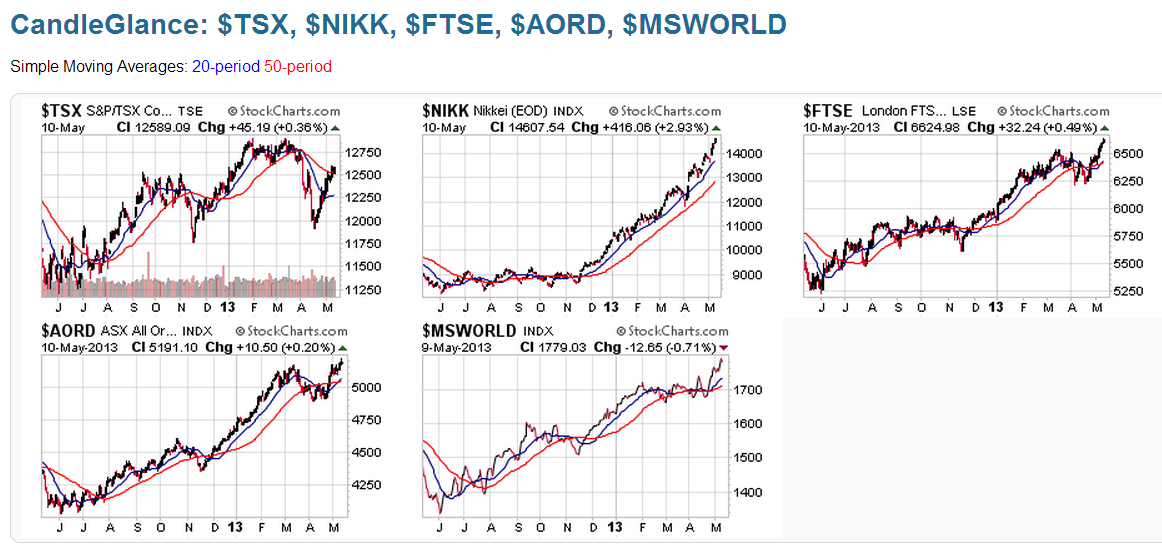
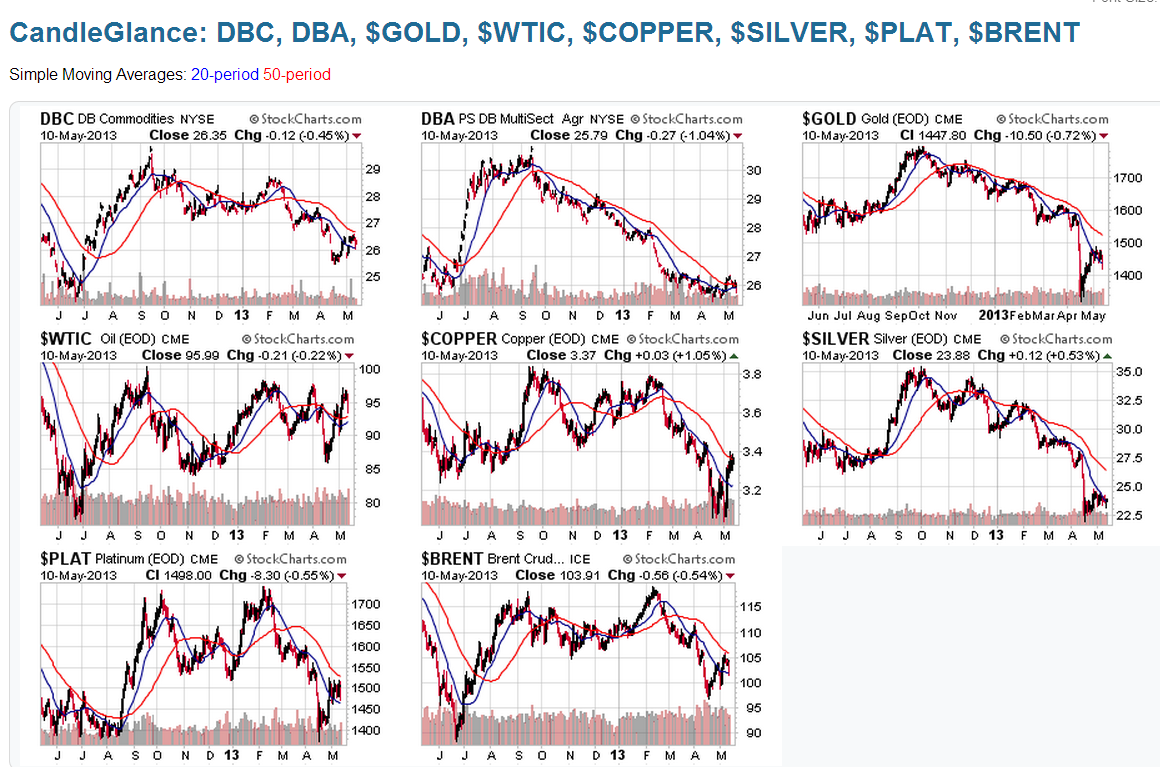
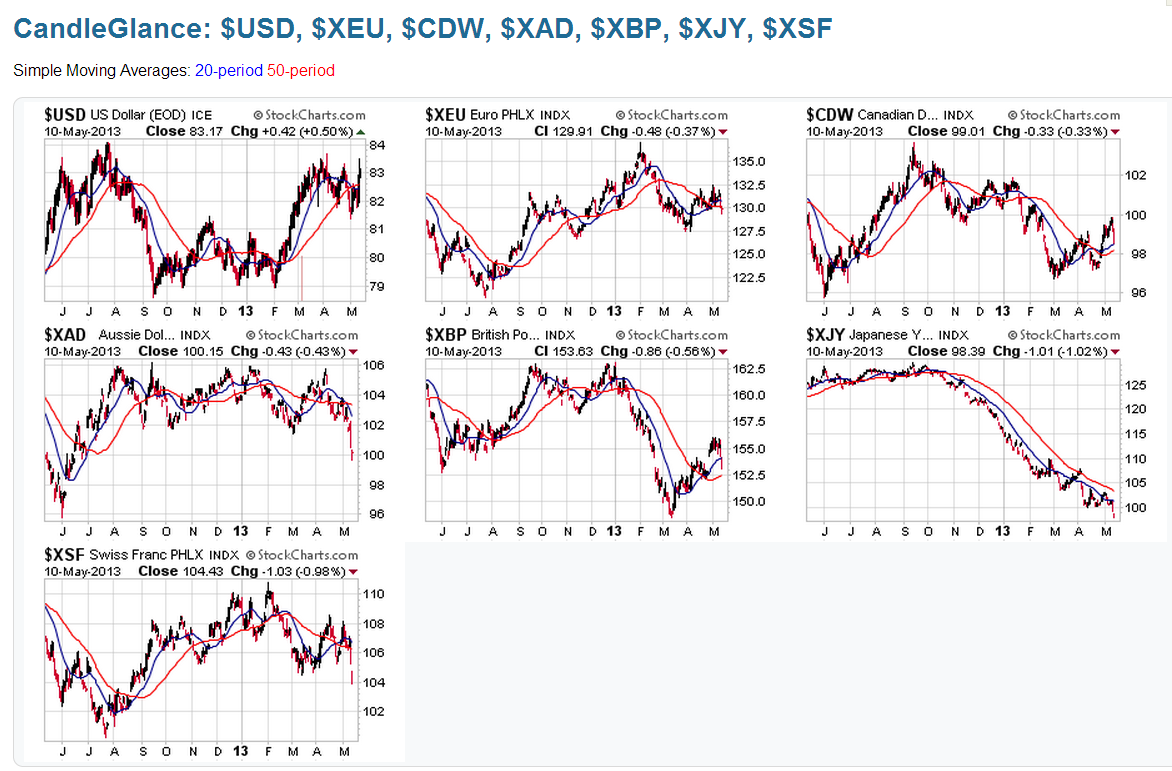
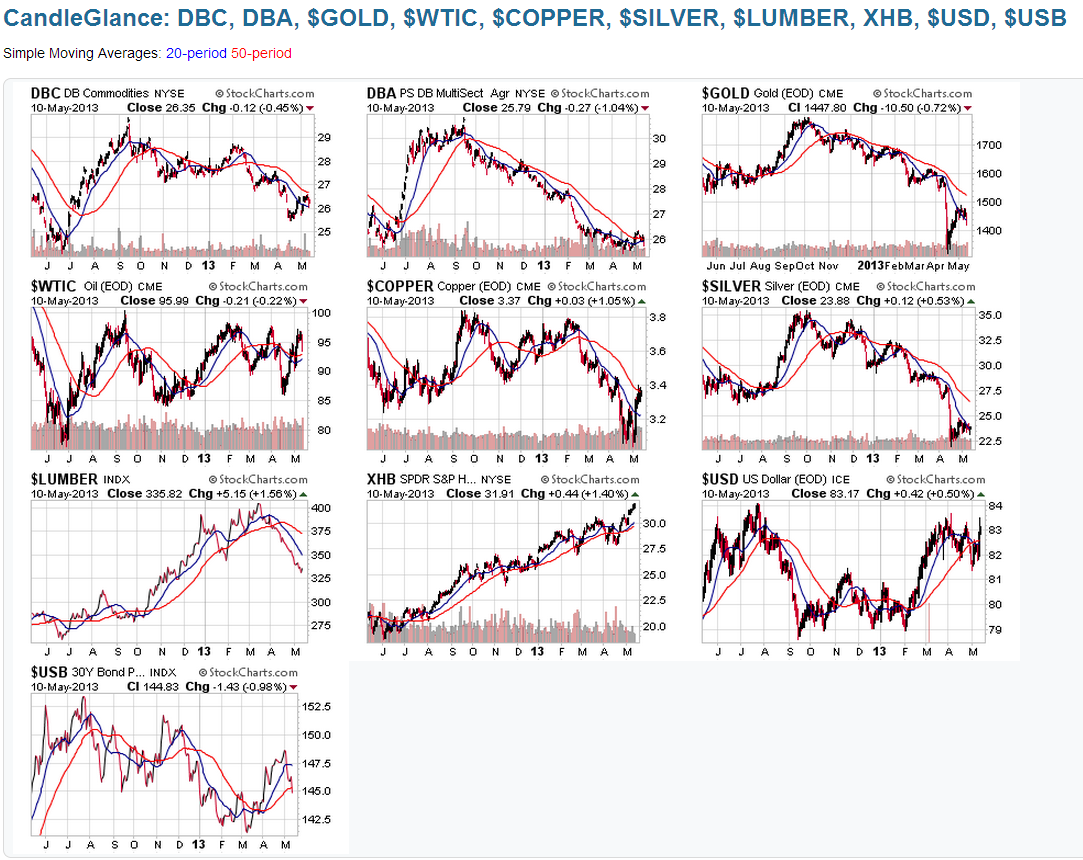
The following 1-Year Daily "thumbnail" charts of various world markets will show, at a glance, where price is currently trading relative to their 50-day MA (red).
You can see which markets have run the furthest distance above the 50 MA (which I'll call Group 1), which ones have either pulled back down to it, or have rallied up to it after dropping below (which I'll call Group 2), and which ones are still below it (Group 3).
We may see some rotation occurring over the next while -- e.g., some profit-taking in those that seem over-extended above the 50 MA (Group 1), and buying in those that are trading around it (Group 2) and below it (Group 3). Included in Groups 2 and 3 are Utilities, Brazil, Russia, China, Canada, the Commodities ETF, the Agricultural ETF, Gold, WTIC Oil, Copper, Silver, Platinum, Brent Crude Oil, the six major currencies vs. the U.S. $, Lumber, and 30-Year Bonds...broadly-speaking, Utilities, Commodities, commodity-producing countries, non-U.S. currencies, and 30-Year Bonds. Of particular interest is the amount of weakness we're seeing in Bonds, which have hit a level of major support...if that support is broken and held, we may see a push up in most markets.
If we do not see buying resume in Group 2, and particularly Group 3, and weakness re-enters those markets, we may then see a general weakening of all markets above the 50 MA. Such an occurrence would then show up on the four preceding charts...which is why one could track the general theme going forward using this simple formula in such a complex world market matrix. No doubt, there are many, more complex, formulas that could be, and are being, used, but I only present this as one possibility.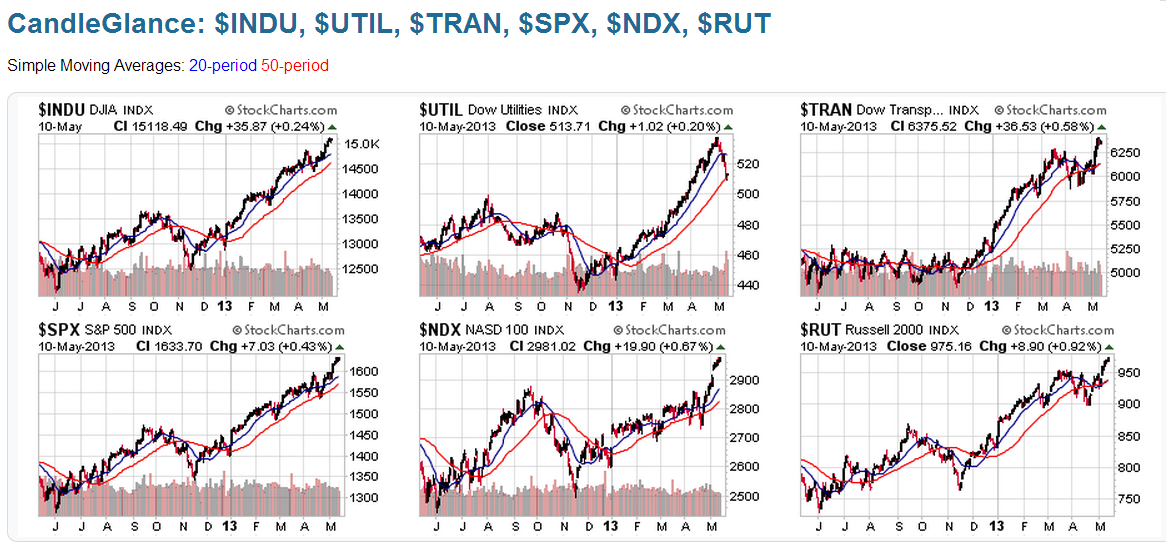
*N.B. Please click this link to see my Addendum post to this one for further Weekly analysis.
Enjoy your weekend and good luck next week! And, since Sunday is Mother's Day, I'd like to take this opportunity to wish all Mothers a very Happy Mother's Day!
