Further to my last Weekly Market Update, this week's update will look at:
- 6 Major Indices
- 9 Major Sectors
- 30-Year Bonds
- U.S. $
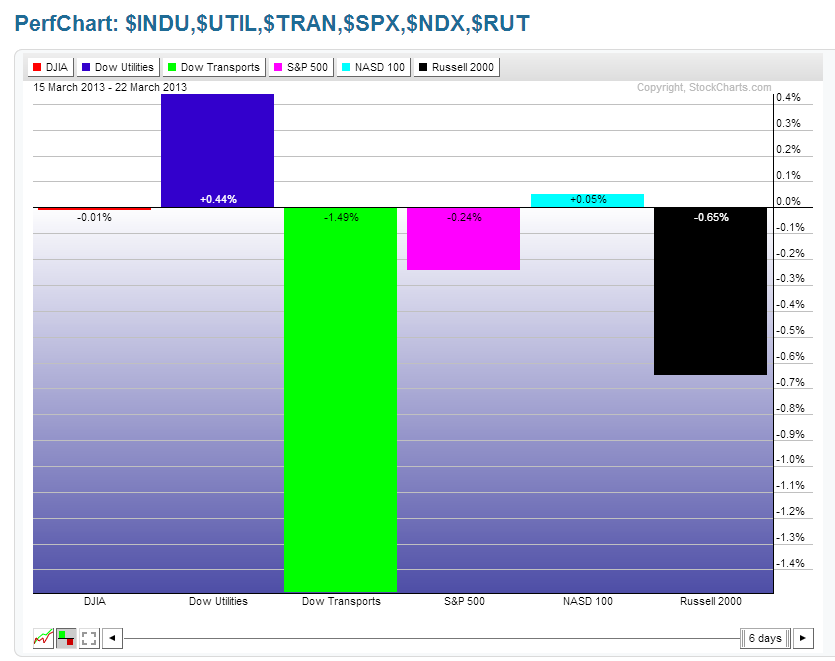
As shown on the Weekly charts and the percentage gained/lost graph below of the Major Indices, there were minor gains in the Dow Utilities, while the Dow Transports lost the most, followed by the Russell 2000 and the S&P 500. The Dow 30 and Nasdaq 100 were flat on the week.
The Indices remain in overbought territory on their Weekly and Monthly timeframes, which may either be viewed as overvalued to some and bullish to others. Next week is a short week, as the markets wind down for month-end, end of Q1 for 2013, and the Easter holiday.
Whether or not the SPX rallies to meet its all-time high of 1576.09 any time this week and whether the Russell 2000 E-mini Futures Index (TF) makes it to 970 by April Fool's Day remains to be seen.
However, inasmuch as Technology is lagging the other Indices this year, I'd keep a close watch on the Nasdaq 100 for signs of improvement or further weakness, since it may influence the other Indices. 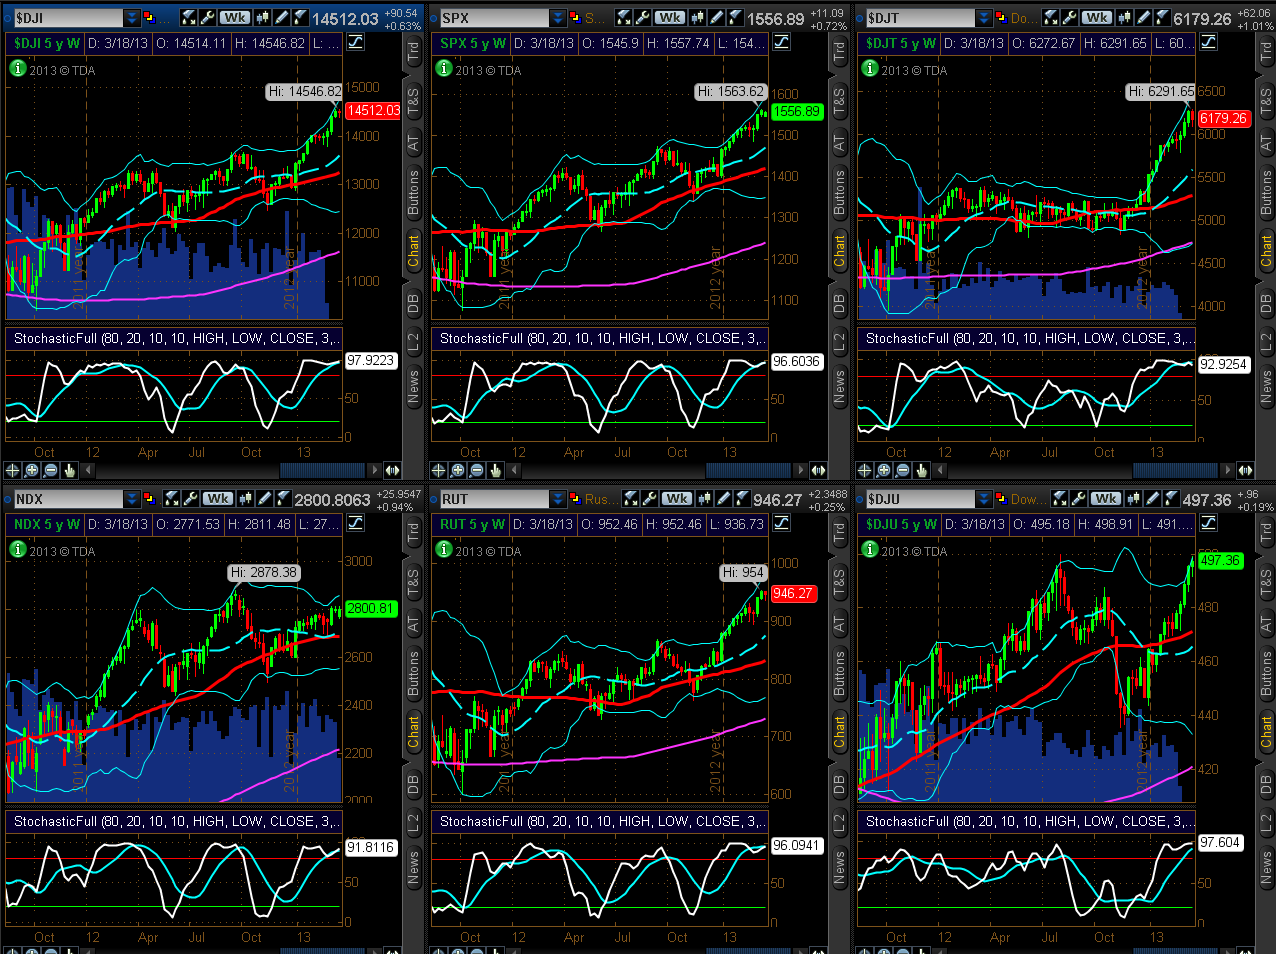
9 Major Sectors
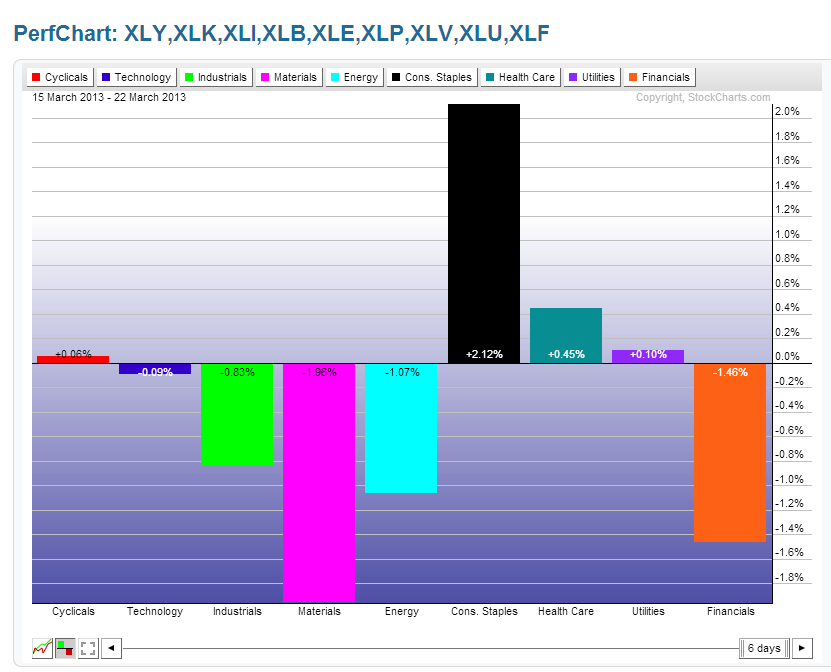
As shown on the Weekly charts and the percentage gained/lost graph below of the Major Sectors, the largest gains made this past week were in Consumer Staples, followed by Health Care. The largest losses were in Materials, followed by Financials, Energy, and Industrials. The others were flat.
We can see that there was a flight-to-safety trade into the "defensive sectors," while profit-taking continued in the higher-risk sectors. All sectors are in overbought territory on the Weekly timeframe (as they are on their Monthly timeframe, with the exception of Technology, which is headed in that direction). 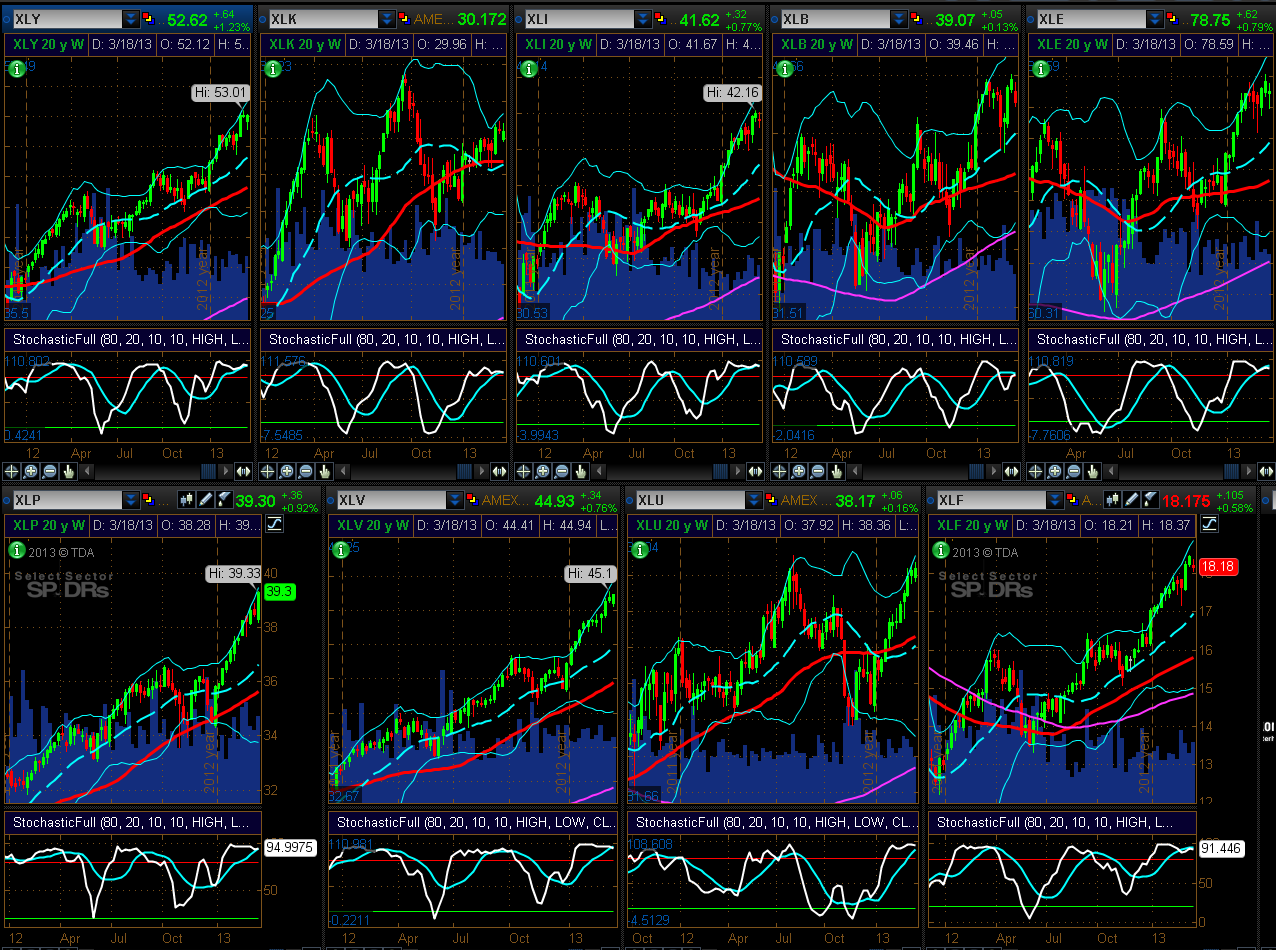
30-Year Bonds
The 5-Year Weekly chart below of 30-Year Bonds shows that price continued its bounce from the prior week, broke back into the middle of what was a recent bear flag (but is no longer), and is sitting in between major support and resistance. There was an increase in volumes this past week as market indecision reigned supreme over Europe's machinations regarding the Cyprus banking crisis/bailout issue, and markets used this as a hedge against risk. I'll need to see major support broken and held on increasing volumes before I'd suggest that perhaps big money is finally flowing out of Bonds to be deployed into equities, and/or commodities, and/or currencies, and/or other instruments. A break and hold above major resistance may coincide with further profit-taking in the Major Indices/Sectors.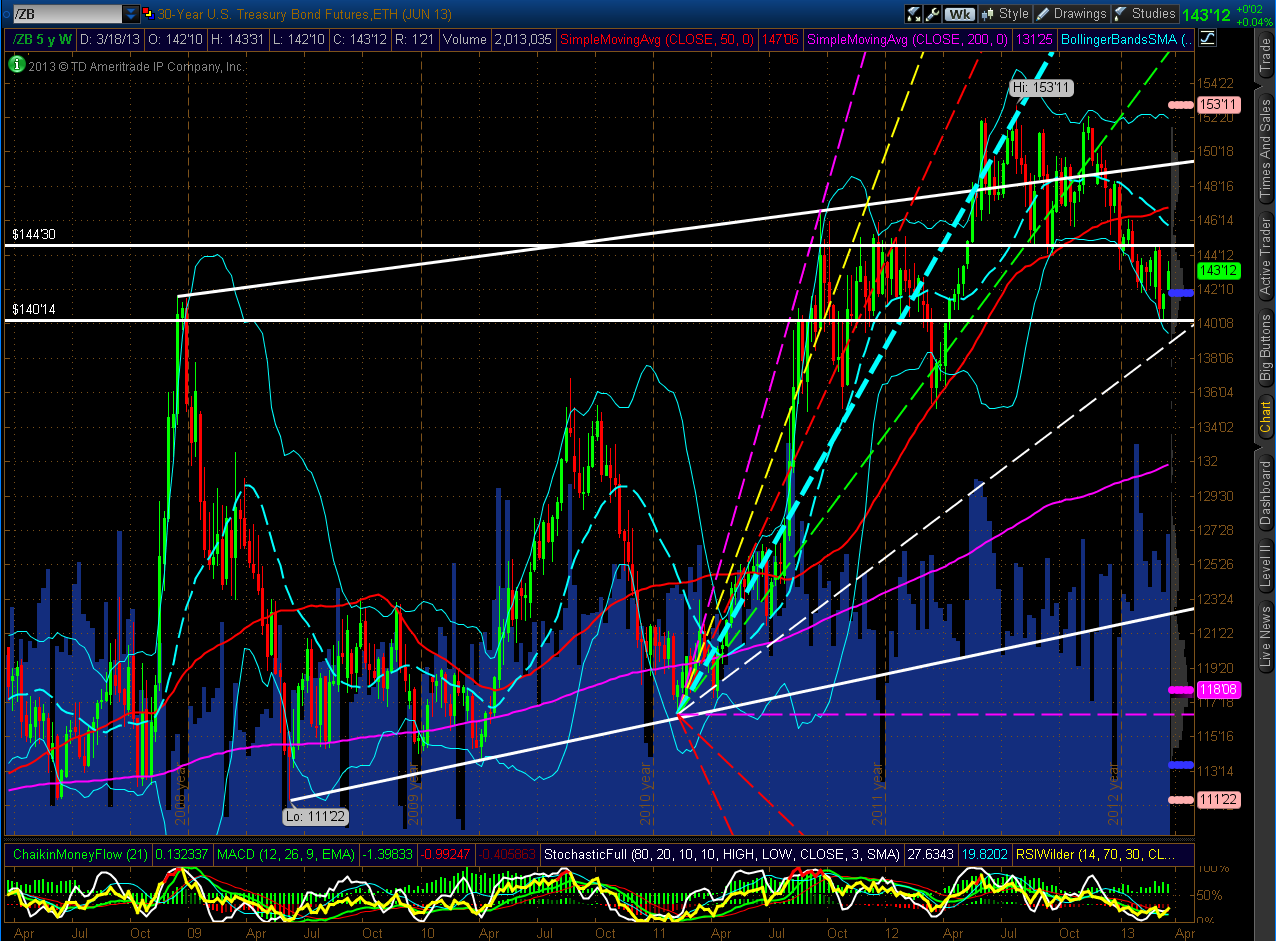
U.S. $
As shown on the 5-Year Weekly chart below of the U.S. $, price continued to bounce around in between Fibonacci resistance and support levels, which happen to represent an important convergence of two 60% Golden Fibonacci ratio levels. A break and hold above its recent highs would be surprising, but is still probable. It may take a pretty hefty catalyst of perhaps a negative global event or domestic financial event to propel the dollar higher, or traders may view this as a safe-haven play in the event the equity markets explode higher in the week(s) ahead.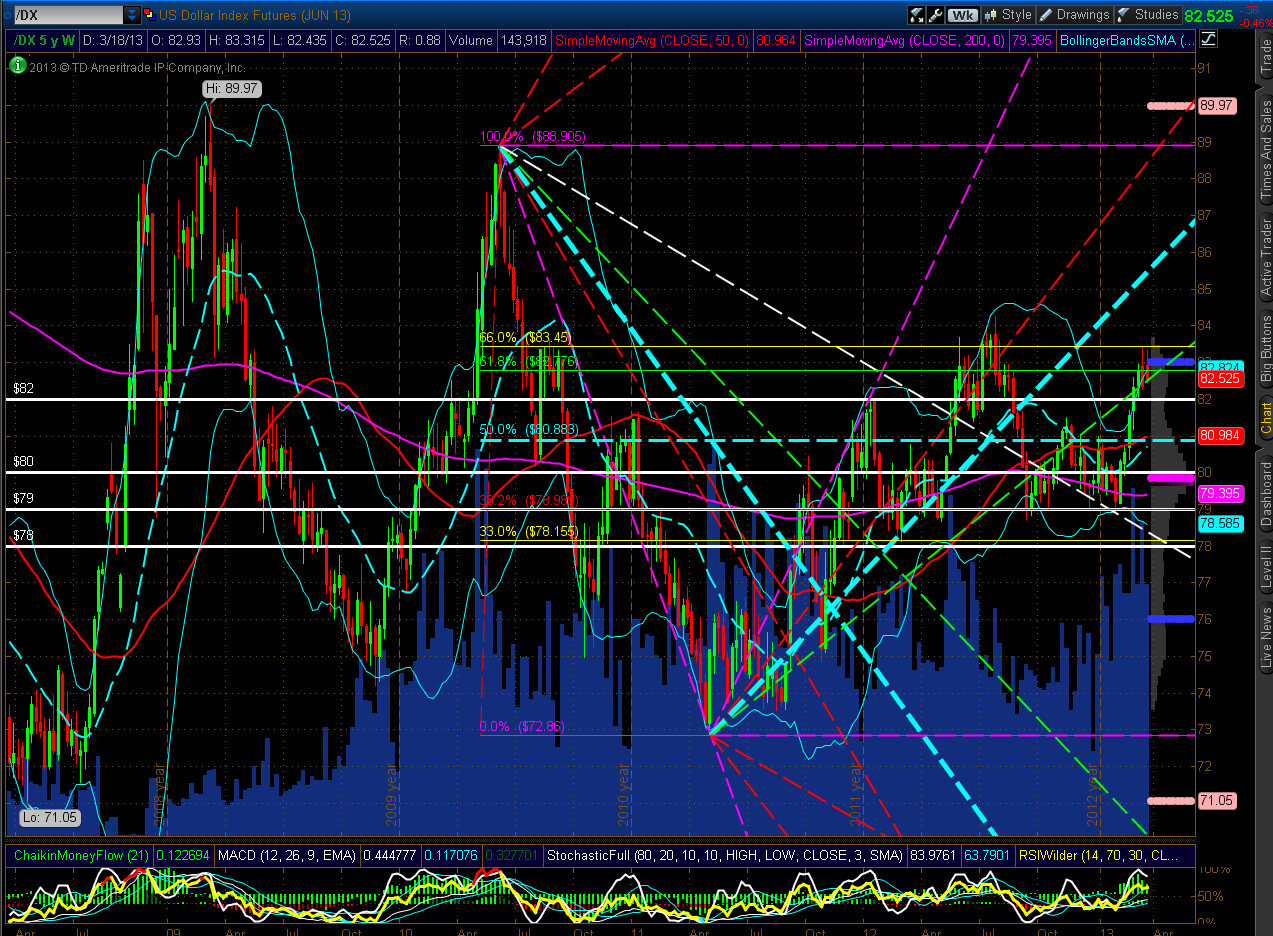
Summary
In a nutshell, indecisive and risk-averse spring to mind in summarizing this past week's market actions. Going forward, we'll see if participants consider markets (including the 'riskier' sectors) to be bullish and ripe for a further rally at current levels, or overvalued with further profit-taking occurring. Any further rise before a meaningful pullback may become parabolic...however, even parabolic rallies eventually run out of steam and usually end up back where they started...something to think about when considering a further rally as being sustainable from current overbought Weekly and Monthly levels.
Enjoy your weekend and best of luck next week...it's a short one due to the market closure on Good Friday.
