Further to my last weekly market update, this week's update will look at:
- 6 Major Indices
- 9 Major Sectors
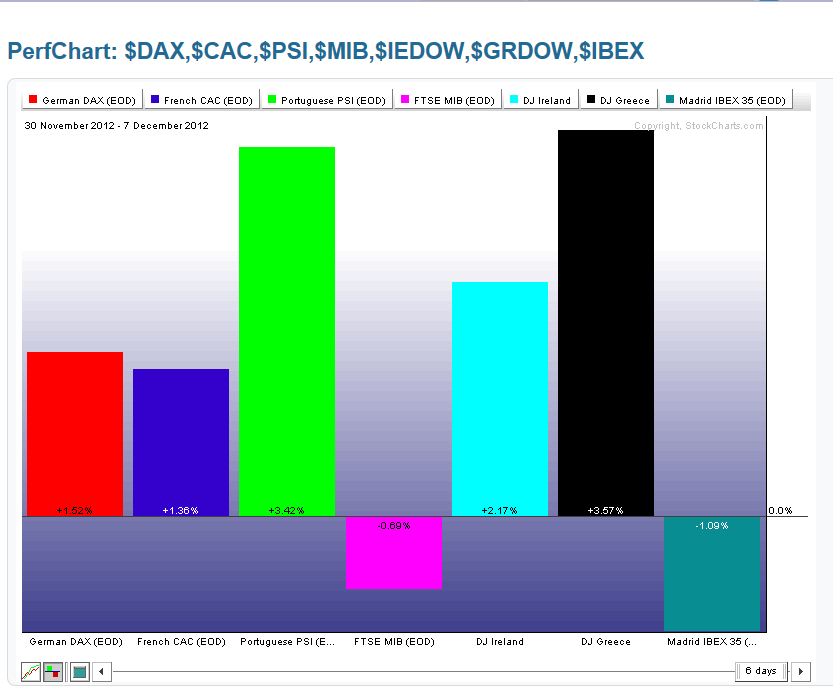
- Germany, France, and the PIIGS Indices
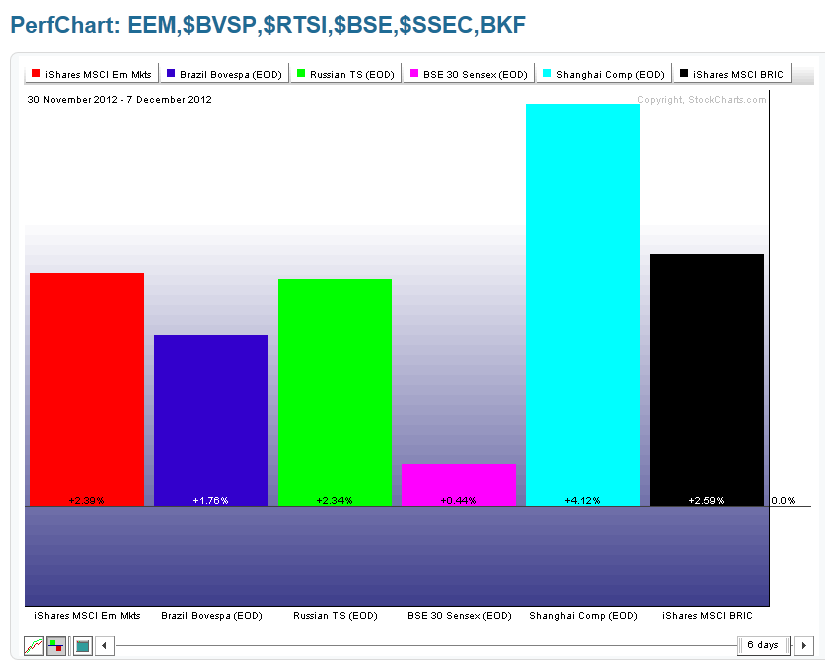
- Emerging Markets ETF (EEM), the BRIC Indices, and the BRIC ETF (BKF)
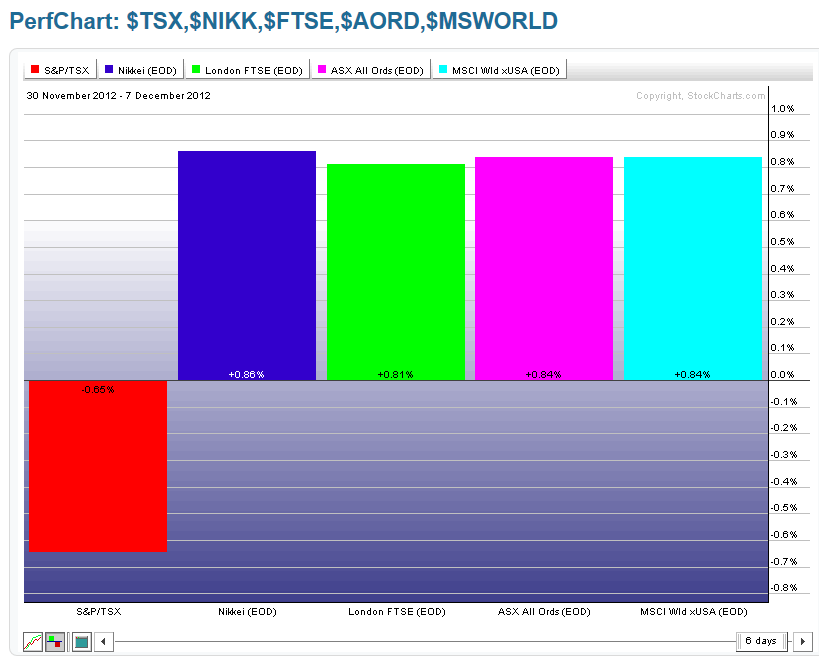
- Canada, Japan, Britain, Australia, and World Market Indices
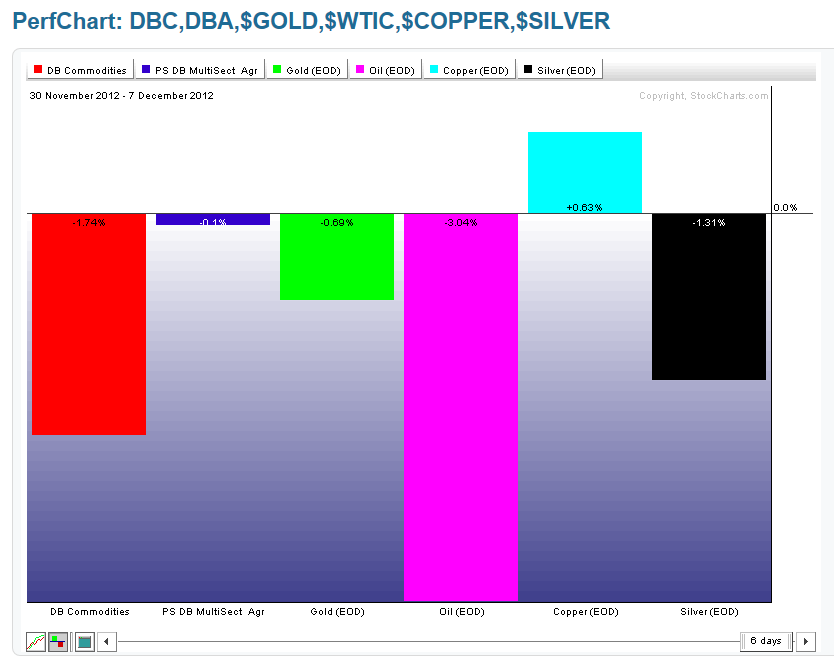
- Commodity and Agriculture ETFs (DBC and DBA), Gold, Oil, Copper, and Silver
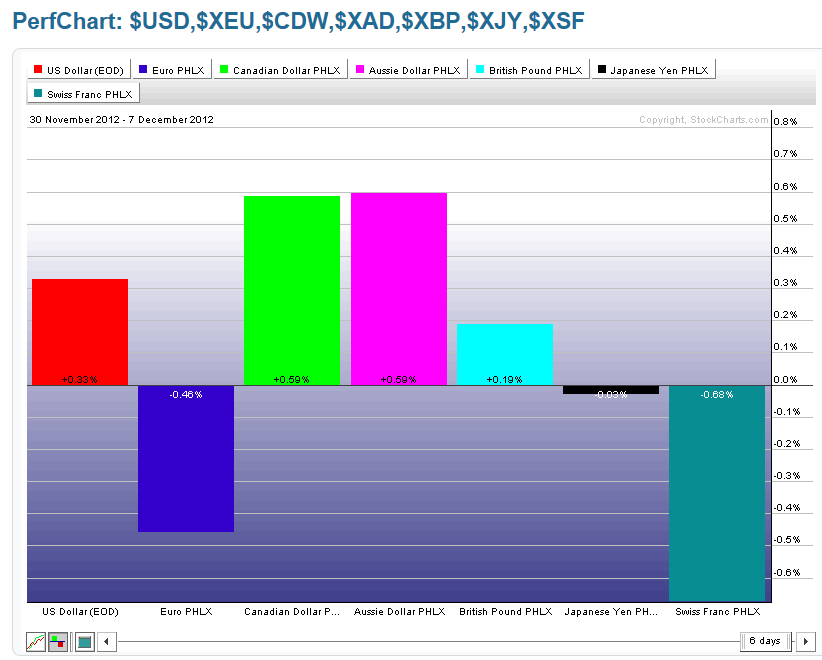
- 7 Major Currencies
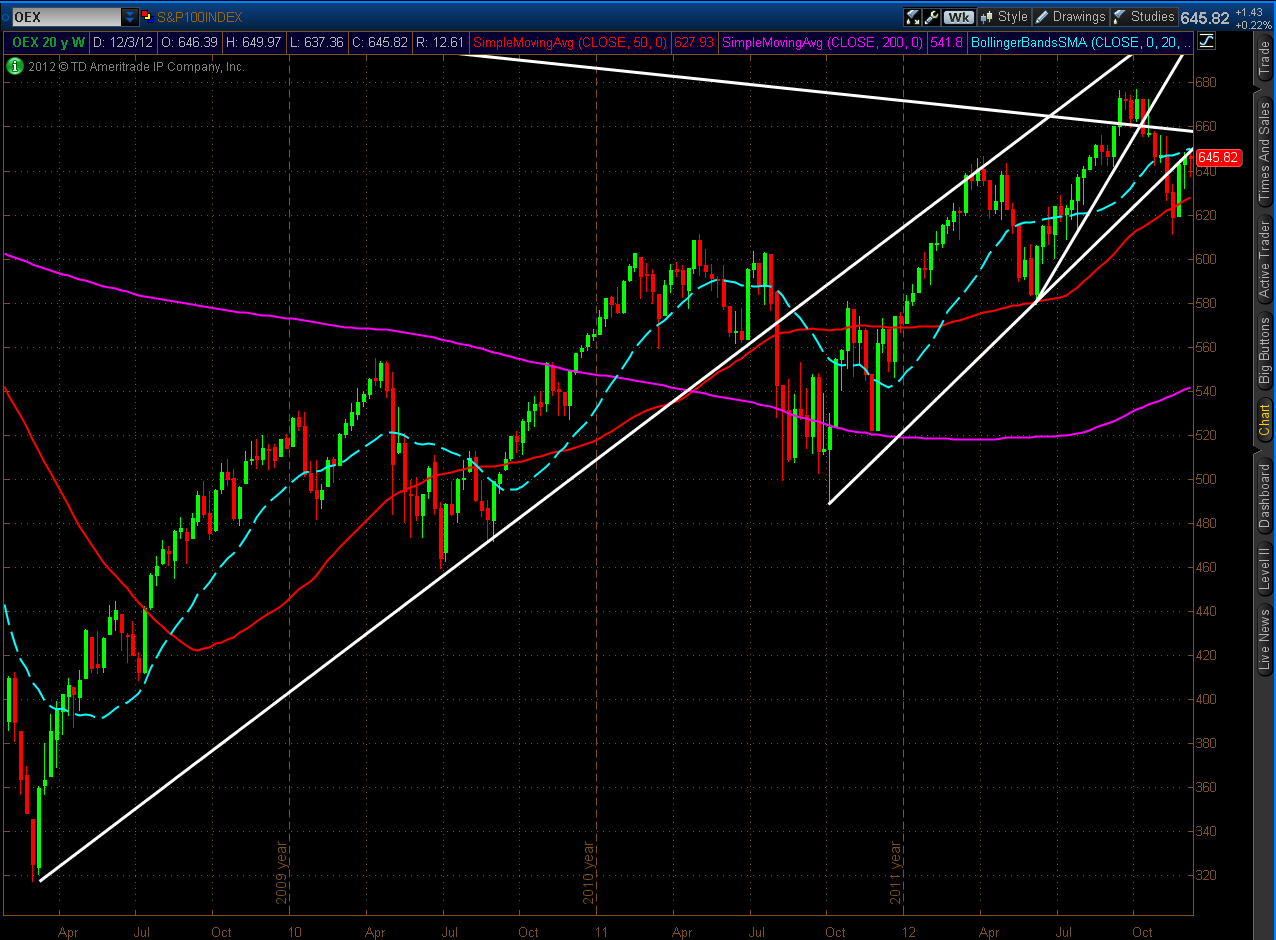
- Major Trendline Breaks on 7 Major Indices
- 30-Year Bonds
, as I simply wanted to show, at a glance, two things:
- where current price is relative to support/resistance levels, and
- which groups money was flowing into and out of this past week
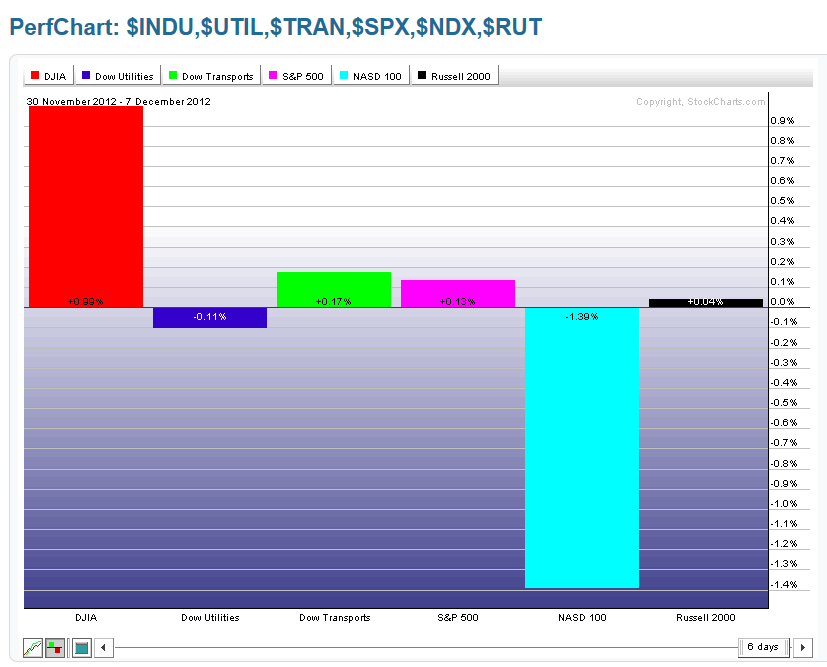
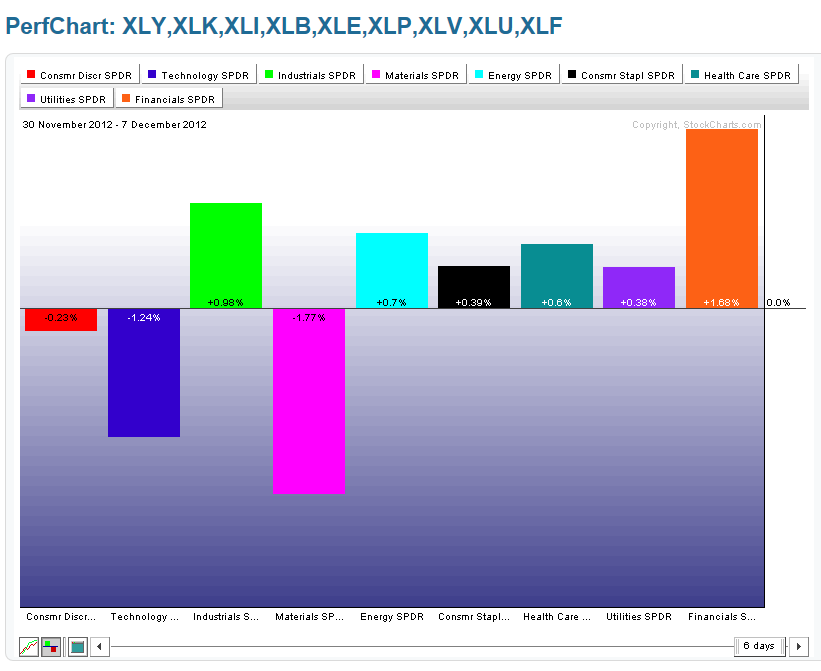
in order to assess whether there was a common theme(s) going on here. In this regard, I've provided 1-Year Daily thumbnail charts and 1-Week percentage gained/lost graphs for each group.
You can see from the Daily charts where current price is relative to resistance/support levels. Most of them are at either downtrend, horizontal, or moving average resistance...although Gold, Oil, Copper, and Silver are hovering above support levels, but threatening to continue downward. That is, in a nutshell, the common theme, at the moment.
Also, you can see from the percentage gained/lost graphs that, generally, there was more buying than selling this past week, except in Technology, Commodities, the Euro, and the Swiss Franc. This is also the common theme, at the moment.
To summarize, the exceptions (Technology, Commodities, the Euro, and the Swiss Franc) are the ones to watch going forward to see if this weakness persists, and to what degree. Furthermore, inasmuch as most Indices/Sectors/Currencies are trading up against some form of resistance, we should be looking for any major news announcement(s) (such as the upcoming FOMC meeting rate announcement and press conference on December 12th) that may either spur continued buying, or dampen and, potentially, reverse this trend. The dreaded "Fiscal Cliff" issue has been the 'topic du jour,' as the U.S. markets continue to make wild intraday swings when one of the political leaders holds a press conference to report that, basically, nothing has been resolved. 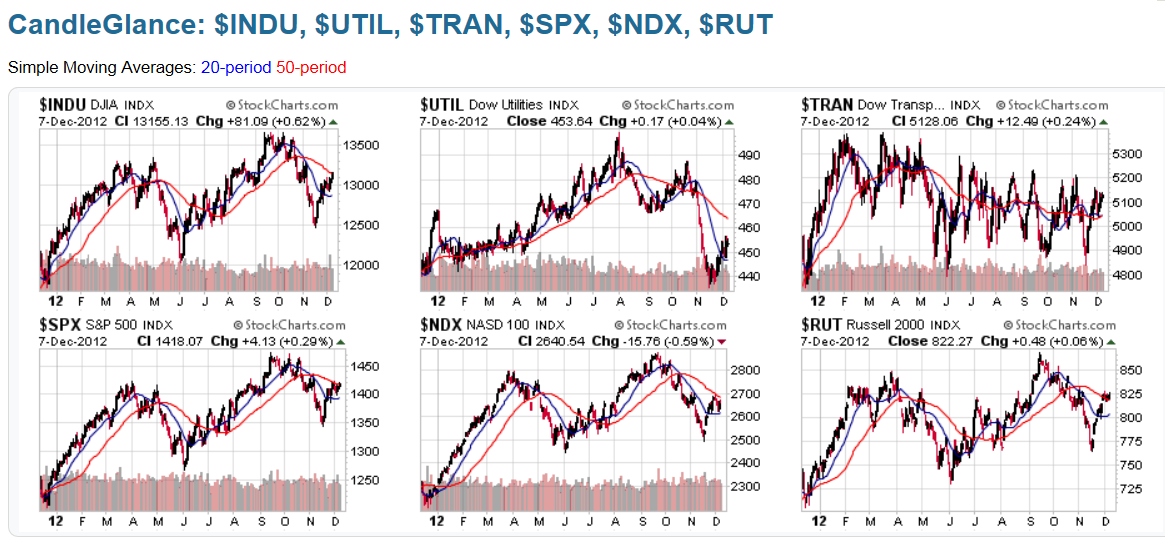
9 Major Sectors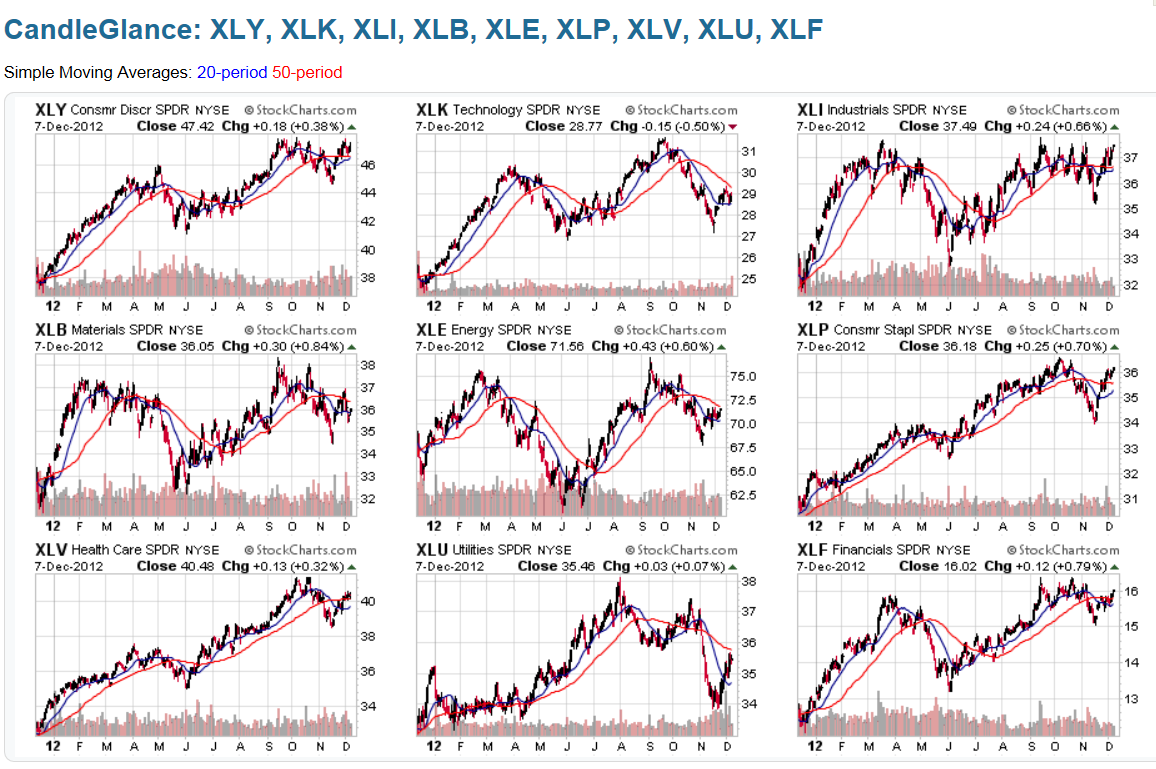
Germany, France, and the PIIGS Indices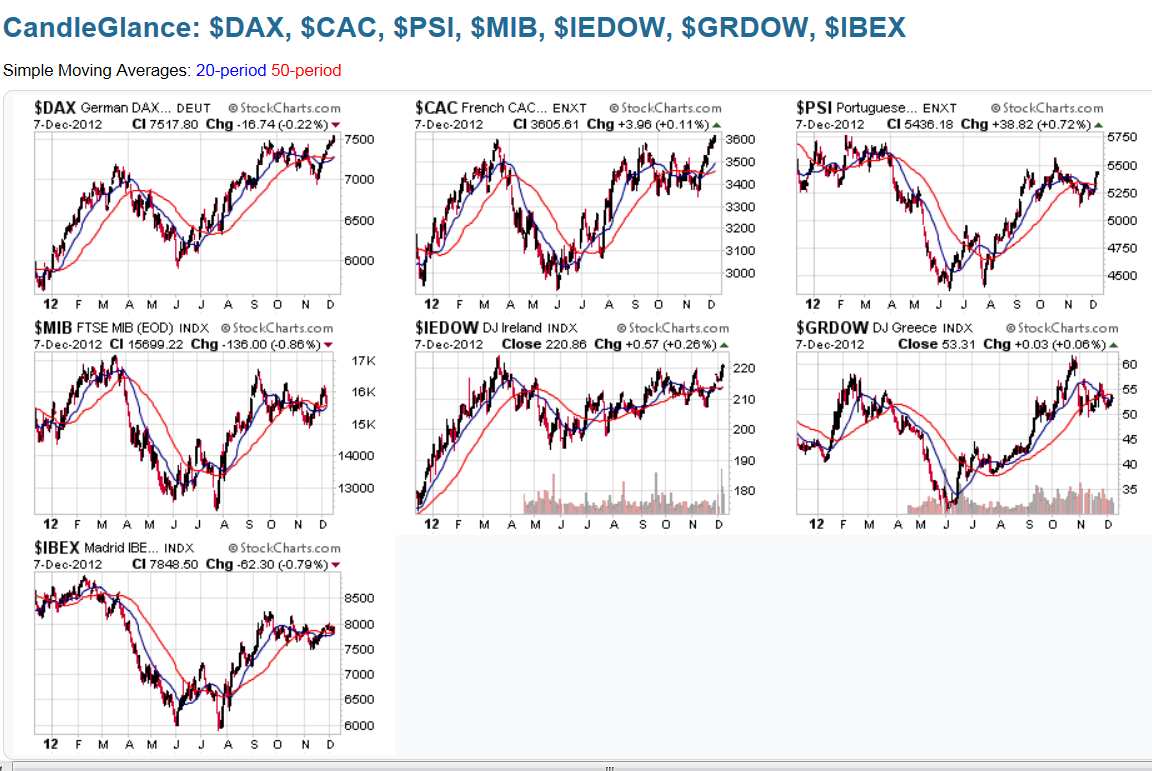
Emerging Markets ETF (EEM), BRIC Indices, and BRIC ETF (BKF)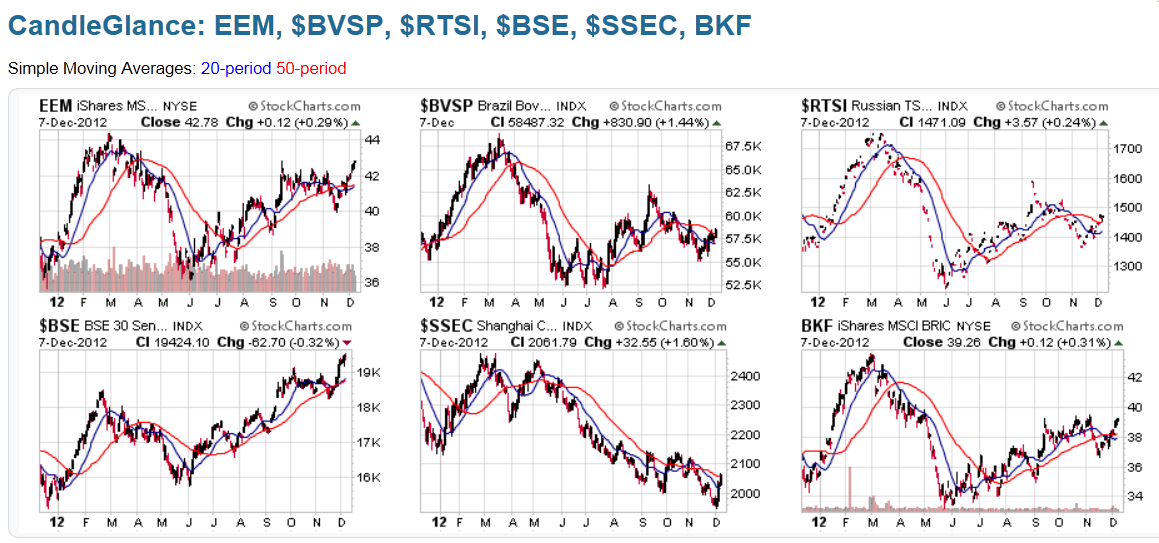
Canada, Japan, Britain, Australia, and World Market Indices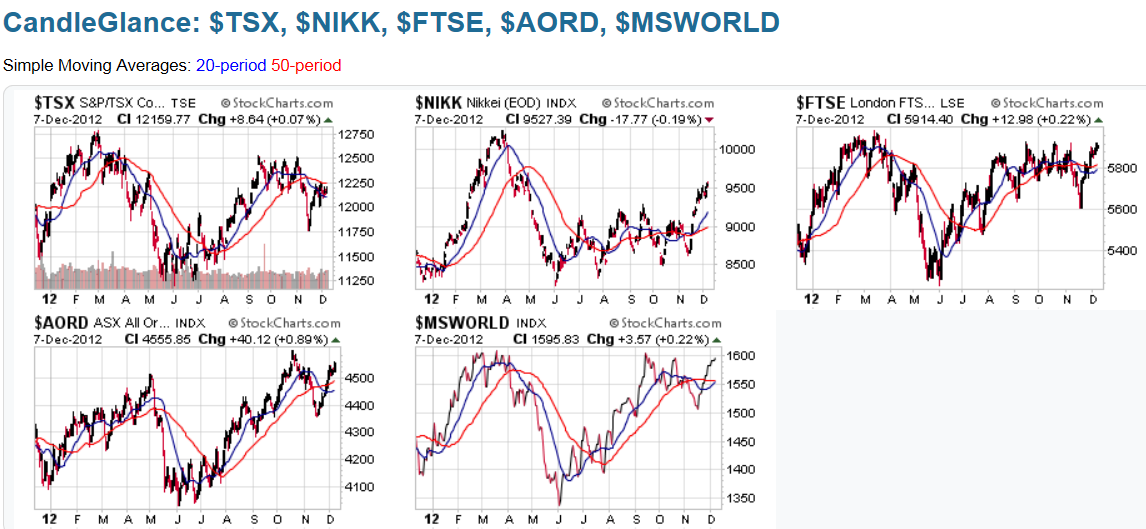
Commodity and Agriculture ETFs (DBC and DBA), Gold, Oil, Copper, and Silver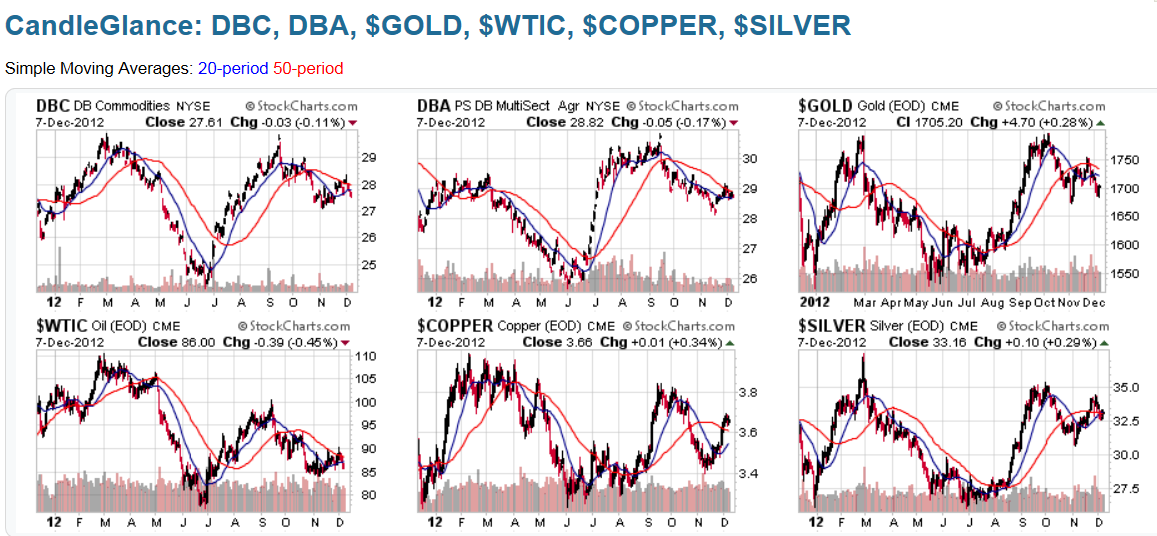
7 Major Currencies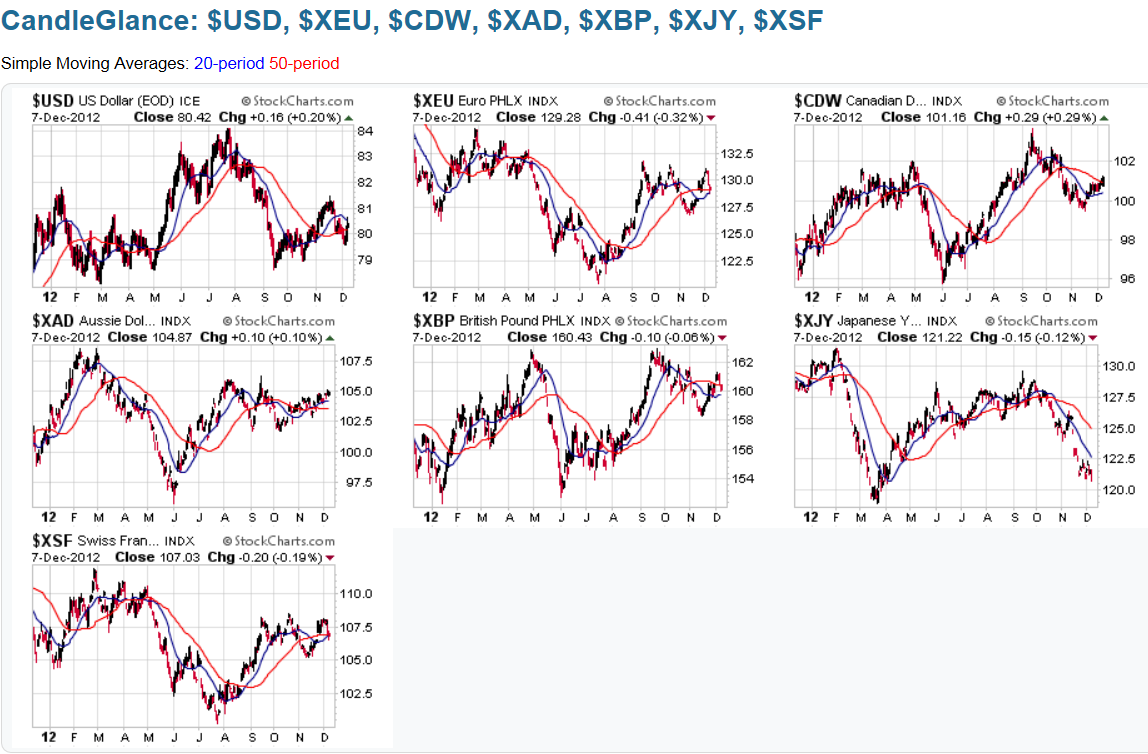
Major Trendline Breaks on 7 Major Indices
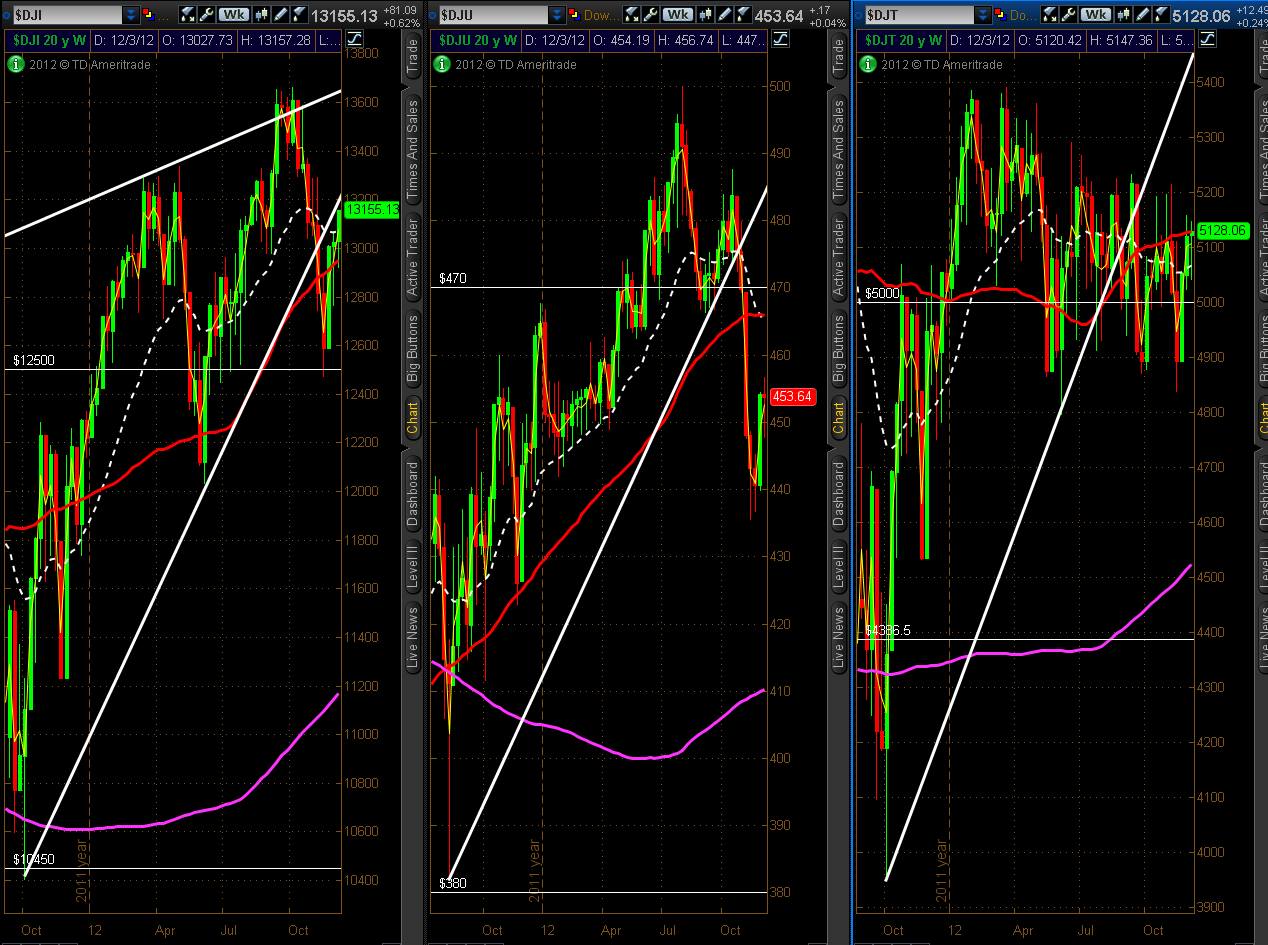
Below are Weekly charts for the Dow 30, S&P 500, Nasdaq 100, Russell 2000, S&P 100, Dow Utilities, and Dow Transports Indices. Drawn on each is a major uptrend line from the October 2011 lows.
As I've mentioned in the past, each index has broken below this major trendline. The only one that has broken back and closed above is the S&P 500 (for the third week in a row). So far, the Russell 2000 and S&P 100 have yet to break and close above, while the Dow 30 played catch-up this week, as shown on the first graph above. The Nasdaq 100 was notably weak, with the pullback in AAPL weighing on this index, as well as on the S&P 500 and 100 Indices.
So, AAPL's movement next week will, no doubt, have a significant impact on the Nasdaq 100, S&P 100, and S&P 500 Indices, and will be a stock to watch, along with the Dow 30 (to see if it continues to outperform the other indices in the week(s) ahead). I last wrote about AAPL here, and my comments are worth noting, as they're still applicable...e.g., see the section on the imminent "Death Cross" forming on both the AAPL and the NDX Daily charts. 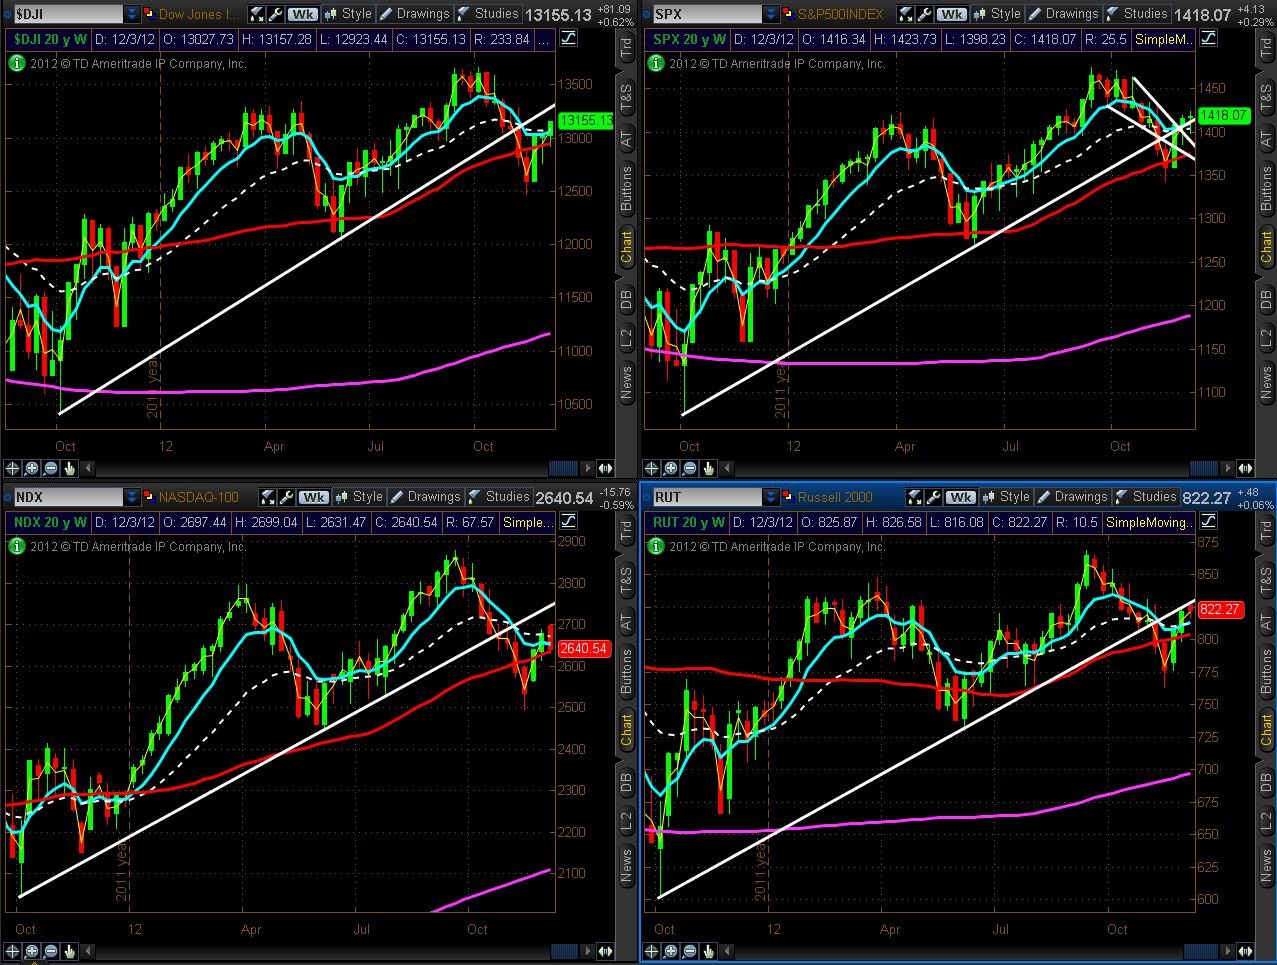
30-Year Bonds
Once again, price on the Weekly chart below of 30-Year Bonds closed on Friday just above near-term support, after retesting a level just below. Failure to hold this support level may induce serious bond-selling, which could begin on a larger scale if price then failed to hold at the next support level (around the lower Bollinger Band/50 sma). Any substantial weakening of Bonds may produce a large-scale rally in equities...one to watch over the next days/weeks. 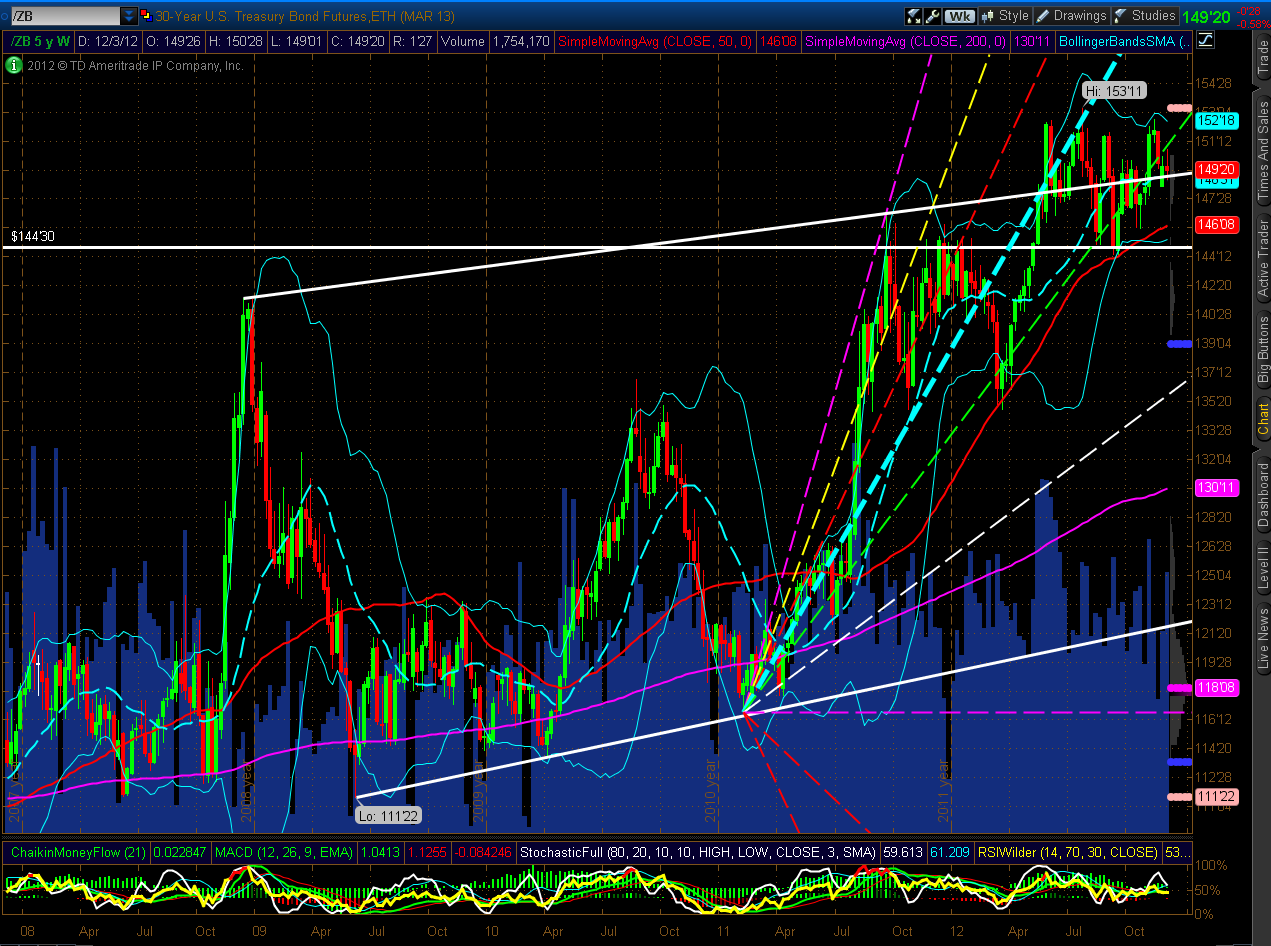
In conclusion, rather than repeat myself, I would just refer you to my comments made this past week in my posts of December 7th, December 2nd, and November 30th, as they are still appropriate for the week(s) going forward (e.g., look for the wild intraday swings to continue).
Furthermore, we may see further buying on the beaten-down high-beta stocks, as has continued this past week, in the Social Media stocks and RIMM, (as shown on the 1-Week percentage gained/lost graph below), as fund managers attempt to top up their yearly portfolio gains before the end of the year. I'll be looking for any parabolic rise and climax on high volumes on stocks such as these as a precursor to a potential major market trend reversal. If this type of stock continues to explode higher in the near-term versus value stocks, I'll also be warned of potential Q4 earnings weakness (markets favouring beta-movers versus actual value). 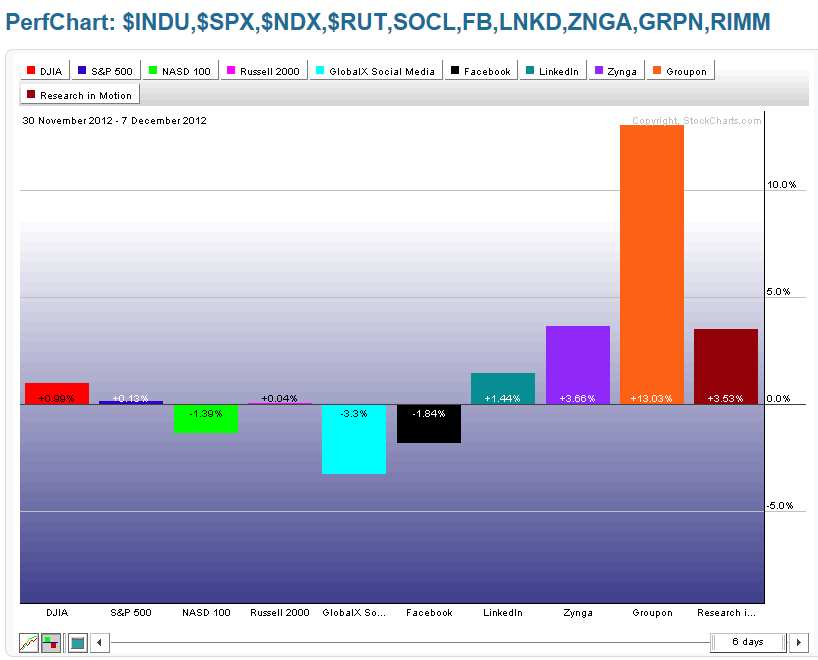
Enjoy your weekend and good luck next week!
