Further to my last Weekly Market Update, this week's update will look at:
- 6 Major Indices
- 9 Major Sectors
- Channel/Fibonacci Projections to the End of Q2 of 2013 for 6 Major Indices
As shown on the Weekly charts and the percentage gained/lost graph below of the Major Indices, the largest gains were made in the Russell 2000, followed by the Nasdaq 100, S&P 500, Dow Transports, Dow 30, and Dow Utilities.

9 Major Sectors
As shown on the Weekly charts and the percentage gained/lost graph below of the Major Sectors, the largest gains were made in Energy, followed by Materials, Financials, Technology, Industrials, Cyclicals, and Utilities. Consumer Staples and Health Care were just below flat on the week.

***UPDATE April 27, 2013: See my next post at this link for further graphs depicting money flow for this past week.
Channel/Fibonacci Projections to the End of Q2 of 2013 for 6 Major Indices
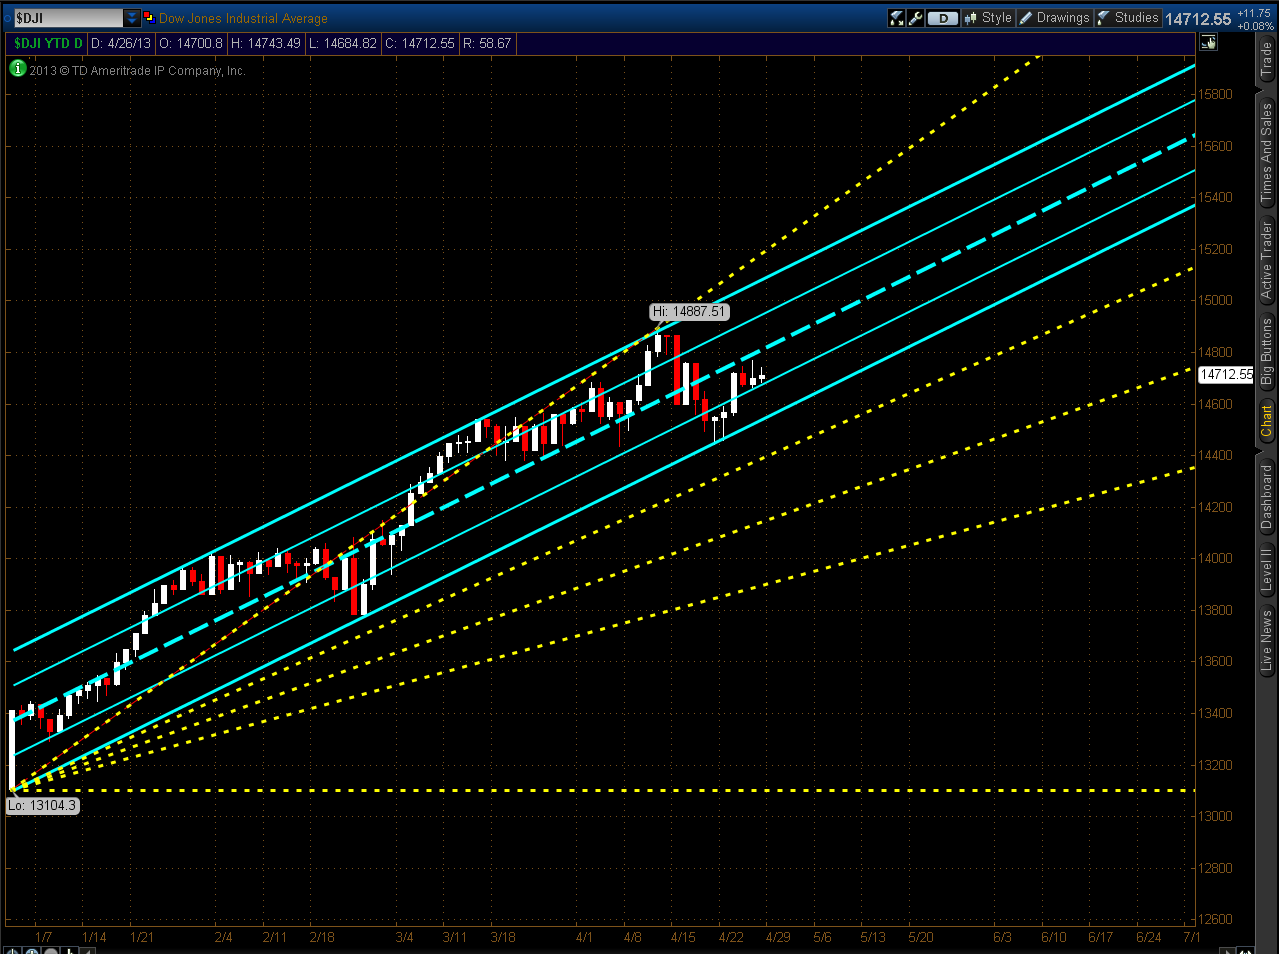
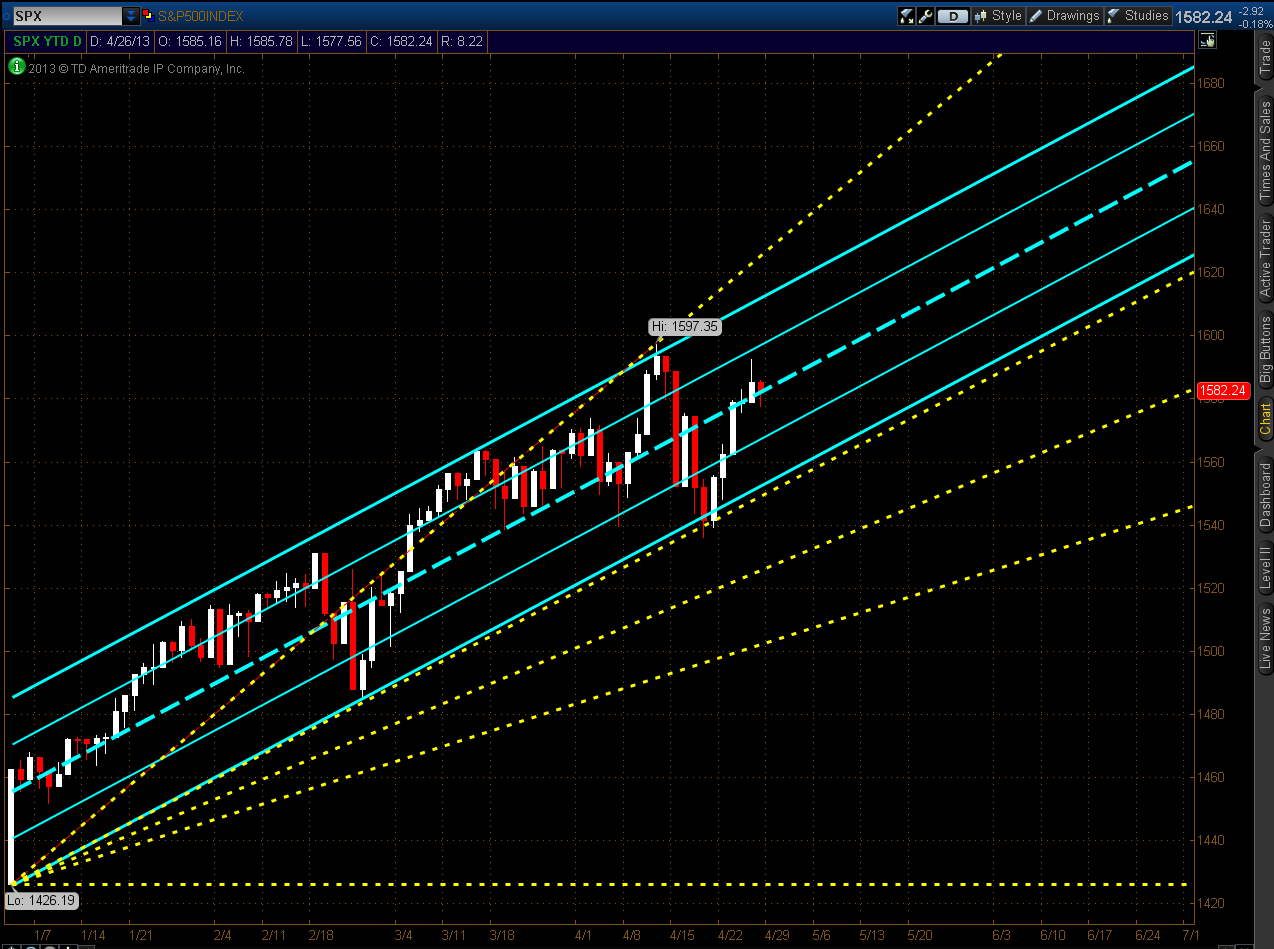
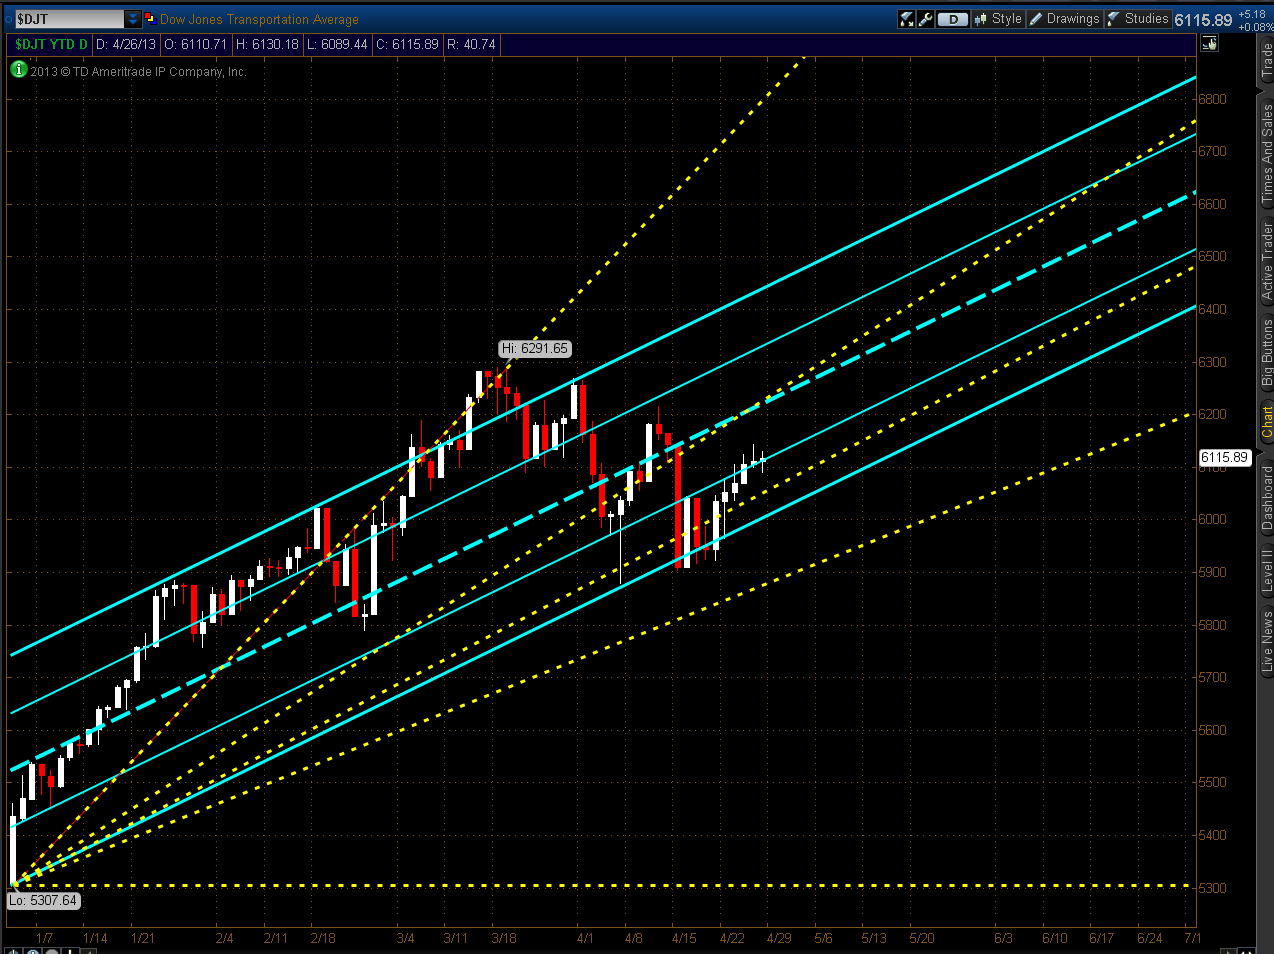
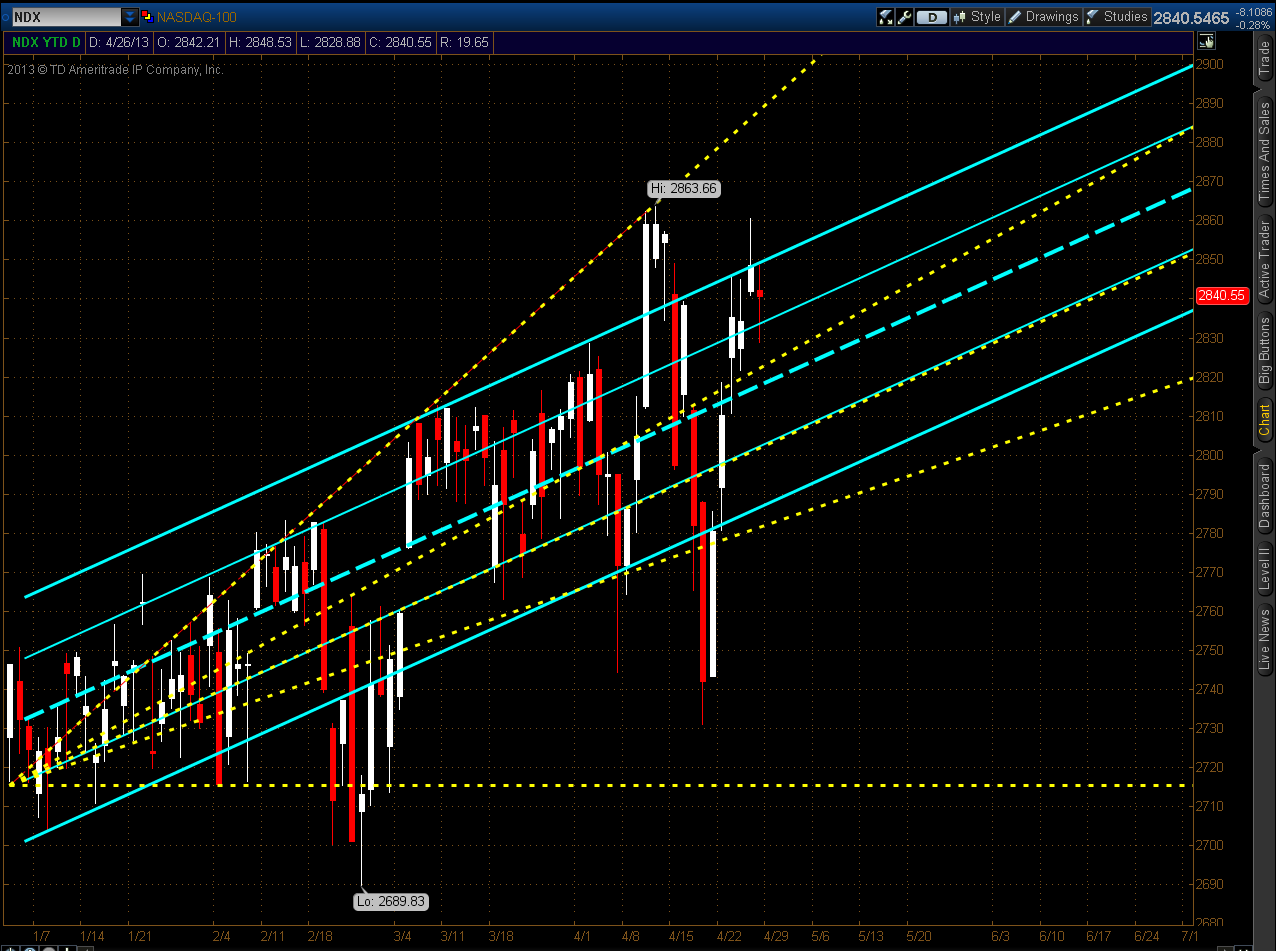
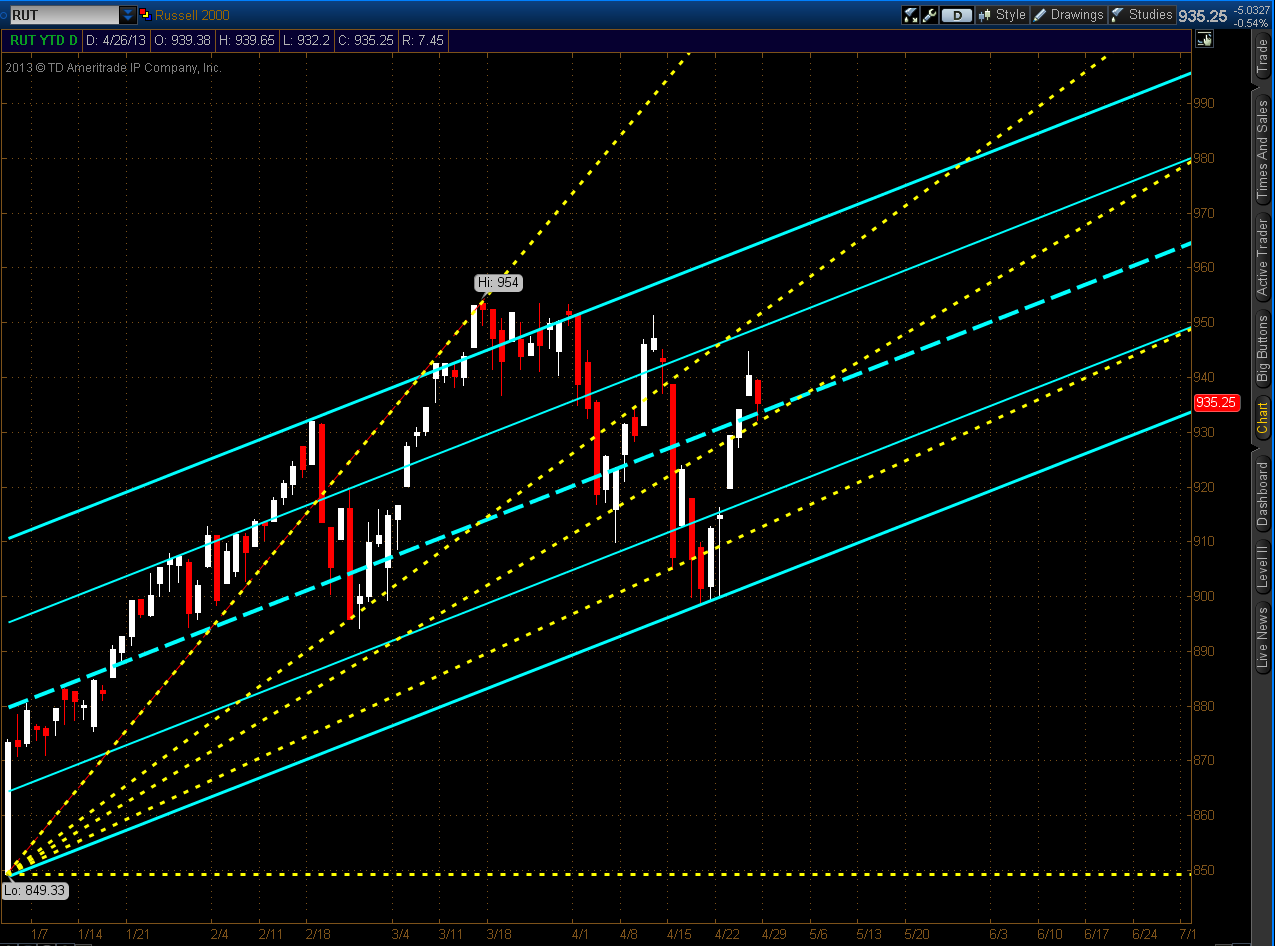
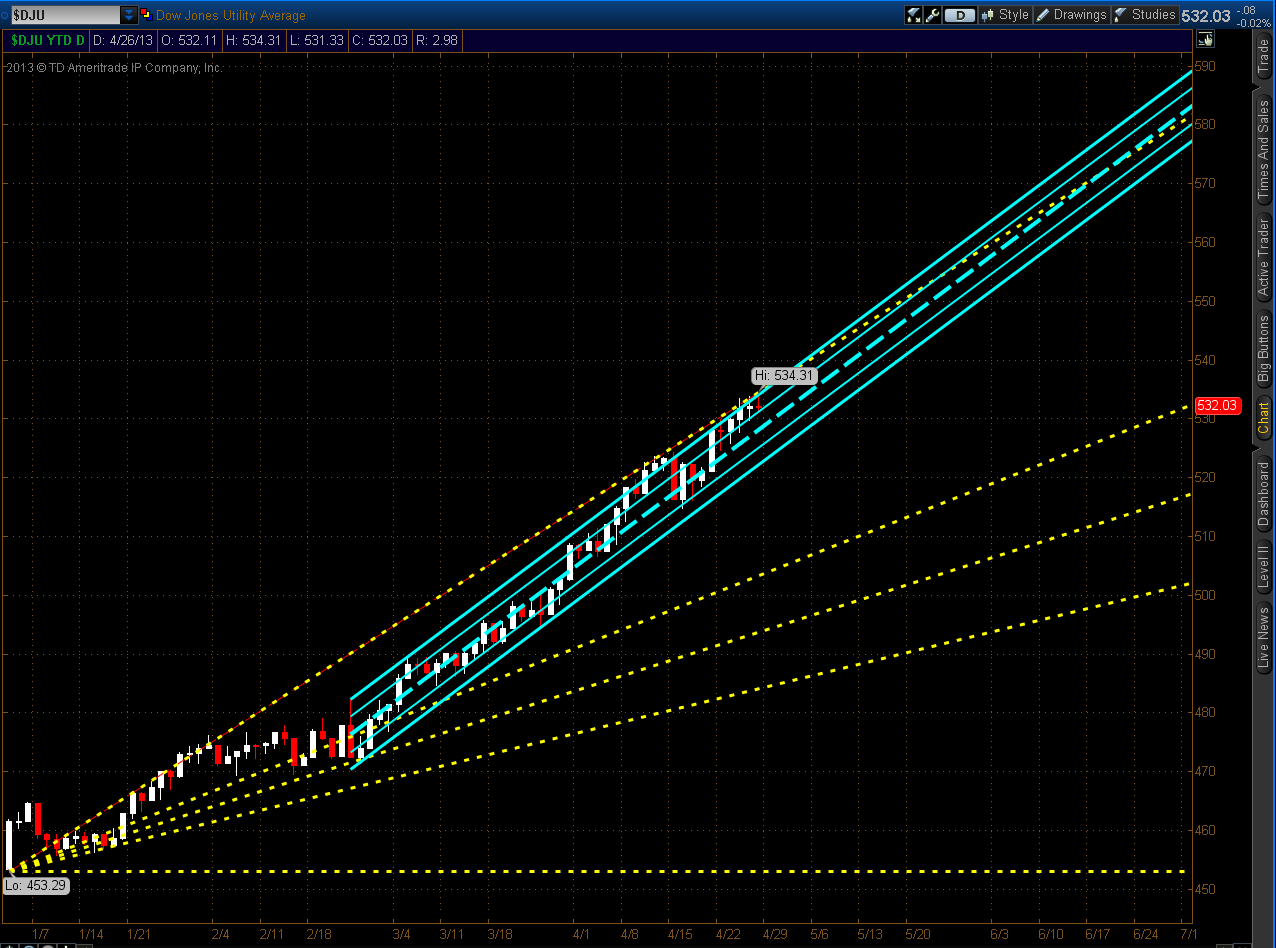
Below are Year-to-date Daily charts for each of the Major Indices. I've drawn a channel (blue lines) and a Fibonacci fan (yellow lines) on each one. I've extended the charts out to July 1 in order to hypothetically project where price might end up by the end of Q2.
Generally speaking, if I were to assume that these indices mirrored their performance of Q1 and that the Q2 GDP came in roughly in line with the average that we've seen since 2010 (see graph at this link), then I'd expect to see price stay within the confines of the channel. That being the case, you can see the range where price could end by the end of Q2. Otherwise, if we were to see more volatility enter the equation over the next couple of months, we could see price drop below the channel and down to one (or more) of the Fibonacci fan lines, or lower.
If we used the mid-channel (broken blue line) as a rough guide to determine bullish or bearish "territory" and the upper and lower 1/4 levels to further define the degree of bullishness/bearishness, I'd say that, as of Friday's close:
- the Dow 30 is "mildly bearish" -- end of Q2 channel range is from 15380 to 15900
- the S&P 500 is "neutral" -- end of Q2 channel range is from 1625 to 1685
- the Dow Transports is "moderately bearish" -- end of Q2 channel range is from 6400 to 6800
- the Nasdaq 100 is "moderately bullish" -- end of Q2 channel range is from 2837 to 2900
- the Russell 2000 is "mildly bullish" -- end of Q2 channel range is from 933 to 995
- the Dow Utilities is "moderately bullish" (it has the steepest channel...we'll see how long price can continue climbing at that angle) -- end of Q2 channel range is from 577 to 588
In terms of volatility that each of these indices has experienced, so far this year, the lowest has been in the Dow Utilities, followed by the Dow 30 and S&P 500. The Nasdaq 100 has been the most volatile, followed by the Russell 2000 and the Dow Transports.
I'd say that if volatility settles down in the Nasdaq 100, Russell 2000, and Dow Transports (barring any unforeseen domestic or global "major incidents"), we could very well see price move upwards generally within the respective channels of all six Major Indices through to the end of Q2. However, if we see volatility continue, we may see a weakening of all six to pull back to their lower channel, or further to one or more of their Fibonacci fan lines, or even lower.
So, in a nutshell, volatility seems to hold the key going forward through to the end of Q2, along with how well the monetary easing programs of World Central Banks perform in the global economies, as outlined in my post of April 25th.