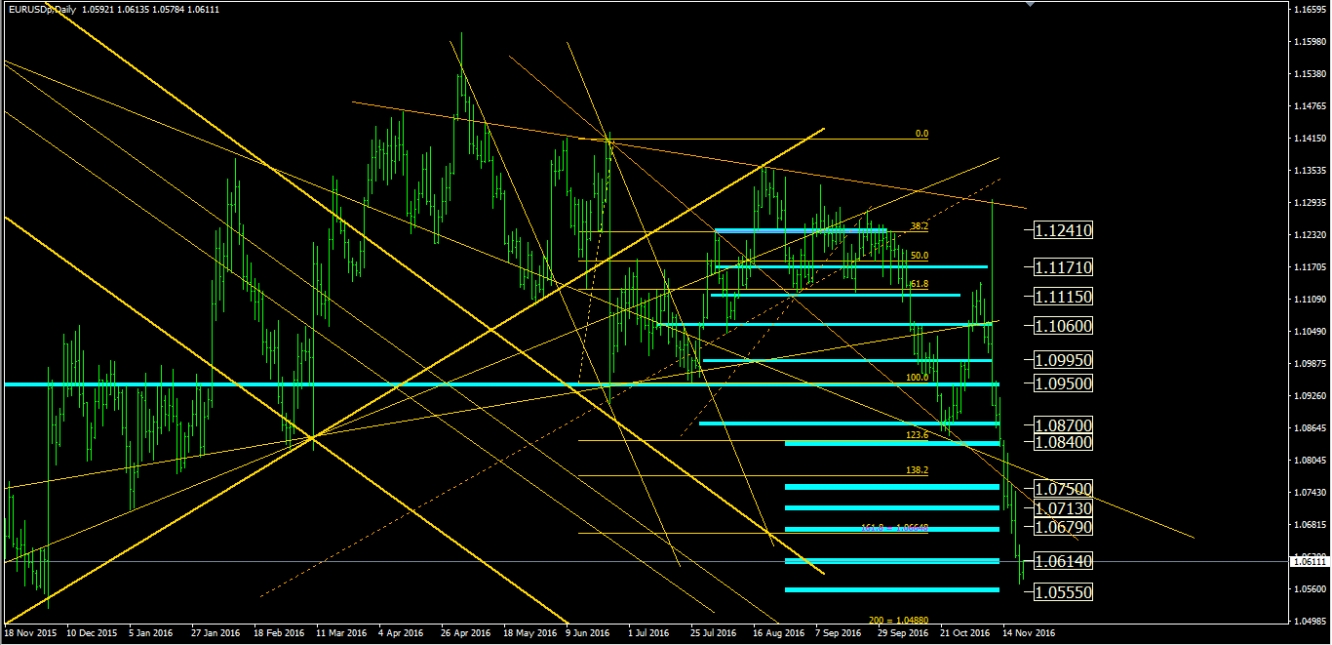
Weekly Trend: Oversold
1st Resistance: 1.0679
2nd Resistance: 1.0713
1st Support: 1.0614
2nd Support: 1.0555
EUR
Recent Facts:
22nd of July 2016, German Manufacturing PMI (key indicator of the activity level of purchasing managers in the manufacturing sector as surveyed in Germany)
Better than expected. Setting a new high from May 2014.
28th of July, German Unemployment Change
Better than expected.
29th of July, European CPI (key preliminary inflation data in Europe)
Higher than expected. Setting a new high since last February.
31st of August, European CPI (key preliminary inflation data in Europe)
Slightly lower than expected.
1st of September, Eurozone Manufacturing PMI
Slightly worse than expected.
29th of September, German Unemployment
Worse than expected.
11th of October, ZEW Economic Sentiment (A level above zero indicates optimism; below indicates pessimism; the reading is compiled from a survey of about 350 German institutional investors and analysts)
Significantly better than expected (59.5).
14th of October, Spanish Inflation + Italian Inflation + Eurozone Trade Balance
Spanish Inflation slightly lower than expected, Italian Inflation as expected, Trade Balance better than expected.
24th of October, German and Eurozone Manufacturing PMI
Better than expected.
25th of October, ECB President Mario Draghi Speech
Today current Interest Rates are protecting the interests of savers and States: Central Bank would certainly prefer not to have to keep interest rates at such a low levels for an excessively long time.
28th of October, German CPI (Preliminary release)
Higher than expected.
2nd of November, Eurozone Manufacturing PMI + Unemployment Change
Better than expected.
8th of November, ELECTION OF THE 45th PRESIDENT OF THE UNITED STATES
Donald Trump elected President.
14th of November, Industrial Production
Better than expected.
15th of November, German GDP (preliminary release) + German ZEW Economic Sentiment
German GDP worse than expected, German ZEW Contrasted.
USD
Recent Facts:
2nd of September, Nonfarm Payrolls
Worse than expected.
16th of September, Core Consumer Price Index (CPI)
Higher than expected.
21st of September, FOMC Economic Projections, Fed Interest Rate Decision
The U.S. Federal Reserve left interest rates unchanged but strongly signaled it could still tighten monetary policy by the end of this year as the labor market improved further.
27th of September, Conference Board (CB) Consumer Confidence
Better than expected (setting a new historical high since October 2007).
7th of October, Nonfarm Payrolls + Unemployment Rate
Nonfarm Payrolls worse than expected, Unemployment Rate Slightly worse than expected.
12th of October, FOMC Meeting Minutes
Fed Says Several FOMC Members Saw Rate Rise ‘Relatively Soon’.
14th of October, Retail Sales + Fed Chair Yellen Speech
Retail Sales slightly better than expected.
Yellen noted an easy interest rate stance “could have costs that exceed the benefits by increasing the risk of financial instability or undermining price stability”.
18th of October, CPI (U.S. Price Inflation)
Slightly worse than expected.
19th of October, Building Permits + Housing Starts
Building Permits better than expected, Housing Starts worse than expected.
20th of October, Philadelphia Fed Manufacturing Index + Existing Home Sales
Better than expected.
26th of October, New Home Sales
Worse than expected but still in the uptrend.
27th of October, Core Durable Goods Orders
Total durable goods orders (which include transportation items) dropped 0.1% compared to economists’ expectations for a gain of 0.1%
28th of October, GDP Q3 (Preliminary release)
Better than expected.
1st of November, Manufacturing PMI + ISM Manufacturing Employment
Better than expected.
2nd of November, ADP Nonfarm Employment Change + FOMC Interest Rates Statement
ADP Nonfarm Employment Change worse than expected.
Fed holds rates steady, sets stage for December hike.
3rd of November, ISM Non-Manufacturing PMI
Worse than expected.
4th of November, Nonfarm Payrolls + Unemployment Rate Change
Nonfarm Payrolls worse than expected, Unemployment Rate as expected.
8th of November, ELECTION OF THE 45th PRESIDENT OF THE UNITED STATES
Donald Trump elected President.
11th of November, Michigan Consumer Expectations/Sentiment
Better than expected.
15th of November, Retail Sales
Better than expected.
16th of November, U.S. Producer Price Index (PPI)
Worse than expected.
17th of November, CPI + Housing Starts + Philadelphia Fed Manufacturing
CPI Worse than expected, Building Permits and Housing Starts better than expected, Philadelphia Fed Manufacturing worse than expected.
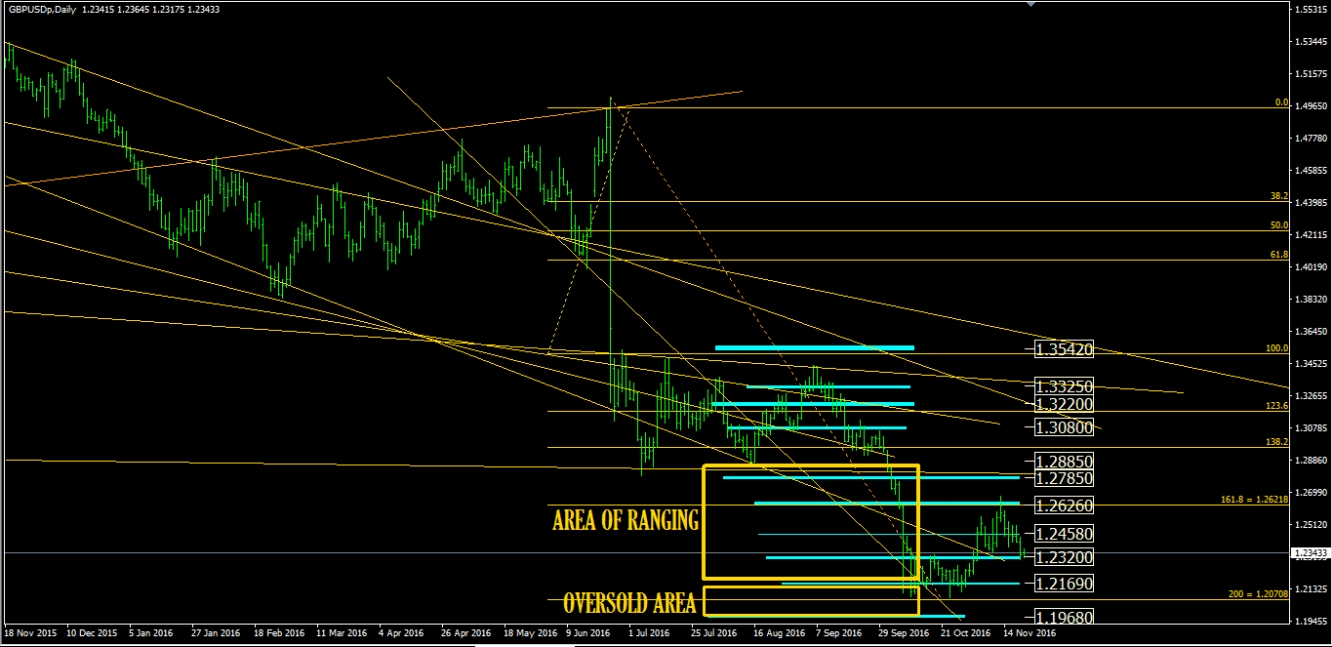
Weekly Trend: Neutral
1st Resistance: 1.2626
2nd Resistance: 1.2785
1st Support: 1.2320
2nd Support: 1.2169
GBP
Recent Facts:
4th of August, Bank of England Interest Rates decision (expected a cut)
Bank of England lowers Interest Rates as expected (record low of 0.25%) and increases purchase program.
9th of August, Manufacturing Production (measures the change in the total inflation-adjusted value of output produced by manufacturers)
Slightly worse than expected.
9th of August, Trade Balance
Worse than expected. Setting a new historical low.
16th of August, UK Consumer Price Index (measures the change in the price of goods and services from the perspective of the consumer. It is a key way to measure changes in purchasing trends and inflation)
Higher than expected. Setting a new high since January 2015.
18th of August, UK Retail Sales
Better than expected. Core Retail Sales YoY at the highest since November 2015.
1st of September, UK Manufacturing PMI (key indicator of the activity level of purchasing managers in the services sector)
Better than expected. Setting a new historical high since December 2015.
5th of September, UK Services PMI
Better than expected.
30th of September, Gross Domestic Product
Pared the expectations.
4th of October, Construction PMI
Better than expected.
18th of October, CPI (UK Price Inflation)
Higher than expected.
19th of October, Job Market (Average Earnings Index + Claimant Count Change + Unemployment Rate)
Average Earnings Index + Claimant Count Change + Unemployment Rate as expected.
Claimant Count Change better than expected.
20th of October, Retail Sales
Worse than expected.
25th of October, Bank of England Gov Carney Speech
BoE will not change how it conducts monetary policy unless Parliament changes its remit but he doesn’t think Prime Minister is asking for a change. Carney added they need to take into account recent FX move (triggered by the timing about article 50 to leave EU and not by BoE decisions).
27th of October, GDP Q3 (Preliminary release)
Better than expected.
1st of November, Manufacturing PMI
Slightly worse than expected.
2nd of November, Construction PMI
Better than expected.
3rd of November, Services PMI + BoE Monetary Policy votes + Interest Rates Decision
Services PMI better than expected, Interest Rates Unchanged and no clues about future change.
8th of November, Manufacturing Production
Industrial Production worse than expected, Manufacturing Production better than expected.
8th of November, ELECTION OF THE 45th PRESIDENT OF THE UNITED STATES
Donald Trump elected President.
9th of November, Trade Balance
Worse than expected.
15th of November, CPI
Worse than expected.
16th of November, Job Market
Claimant Count Change (which measures the change in the number of unemployed people in the UK during the reported month) worse than expected.
17th of November, Retail Sales
Better than expected.
USD
Recent Facts:
See above.
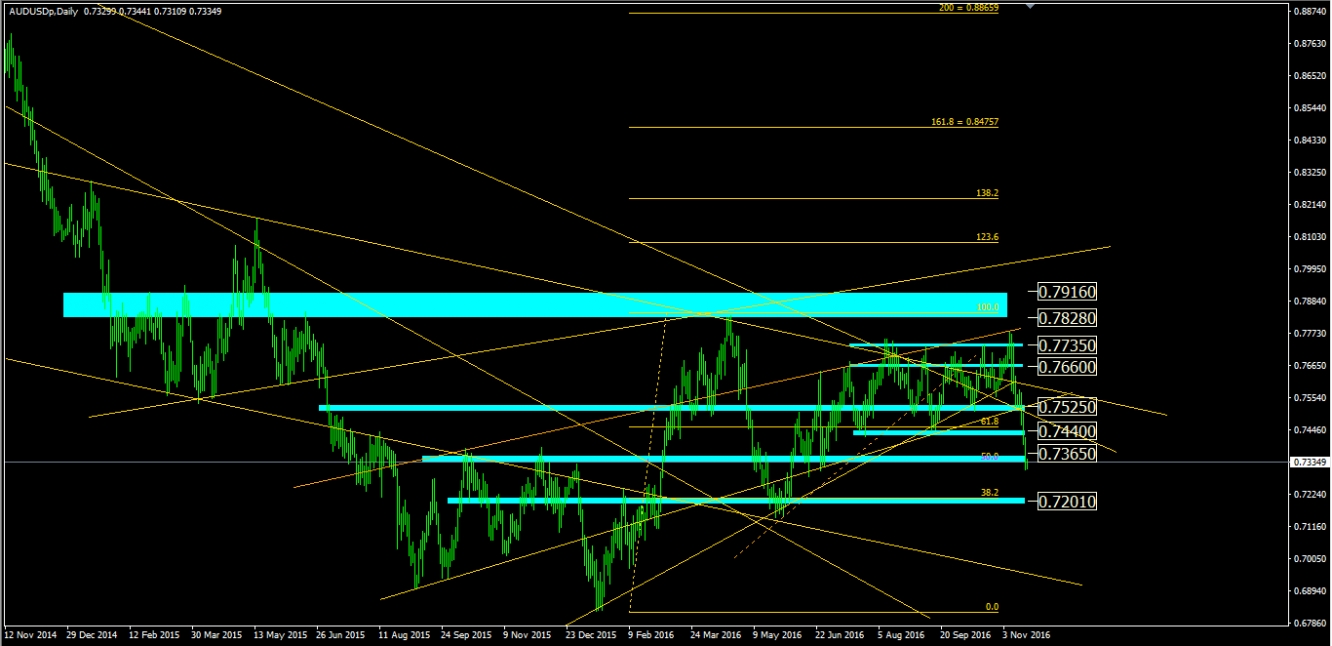
Weekly Trend: Oversold
1st Resistance: 0.7440
2nd Resistance: 0.7525
1st Support: 0.7365
2nd Support: 0.7201
AUD
Recent Facts:
19th of July 2016, Reserve Bank of Australia Meeting
Possible further easing in the next month to counteract the negative shock from the Brexit vote.
26th of July, CPI (key inflation data in Australia) pared.
2nd of August, Interest Rates decision cut to from 1.75% to 1.50% as expected.
4th of August, Retail Sales (Jun)
Worse than expected.
11th of August, Reserve Bank of New Zealand's rate statement
Interest rates cut (to 2%) as expected.
18th of August, Employment Change
Better than expected. Highest since the beginning of this year.
24th of August, New Zealand Trade Balance and Australia’s Construction Work Done (it measures the change in the total value of completed construction projects)
Worse than expected.
1st of September, Retail Sales and Private New Capital Expenditure
Worse than expected.
7th of September, Australia Gross Domestic Product
As expected.
15th of September, Employment Change
Worse than expected.
4th of October, Interest Rate Decision + RBA Rate Statement
Central Bank keeps Interest Rate unchanged but cites concerns on growth over a strong currency, building and housing data showing a continued negative trend.
14th of October, Reserve Bank of Australia Financial Stability Review (it is released twice per year and contains an assessment of conditions in the financial system and potential risks to financial stability)
Australia's central bank released a financial stability review that highlighted some regional risks in apartment construction.
Australian watchdog says bank 'oligopoly' needs more reform.
18th of October, Reserve Bank of Australia Meeting Minutes
RBA's Governor Philip Lowe said that Inflation Expectations declined, but not that much and that current level of AUD and rates is suitable for economy.
In the meantime New Zealand Consumer Price Index came in at 0.2%, above expectations (0%) in 3Q.
20th of October, Job Market Data
Worse than expected.
26th of October, Inflation Data (CPI)
Higher than expected.
1st of November, RBA Interest Rates Statement
RBA’s Governor Lowe signals tolerance for weak inflation and bets seem off for future rate cuts.
3rd of November, RBA Monetary Policy Statement + Retail Sales
RBA said it is focused on the medium-term inflation target.
Retail sales better than expected.
8th of November, ELECTION OF THE 45th PRESIDENT OF THE UNITED STATES
Donald Trump elected President.
9th of November, Reserve Bank of New Zealand Interest Rate Decision + Monetary Policy Statement
Interest Rates cut to 1.75% from 2.00% as expected.
17th of November, Employment Change
Slightly worse than expected.
USD
Recent Facts:
See above.


