
Molson Coors Brewing Company (NYSE:TAP) has reported fourth-quarter 2018 results, wherein the bottom line surpassed estimates while the top line lagged. This marked the company’s third straight quarter of positive earnings surprise. Meanwhile, sales missed estimates after two consecutive beats. The top line was impacted by soft volume in the United States and Canada, which also led to a decline in global brand volume.
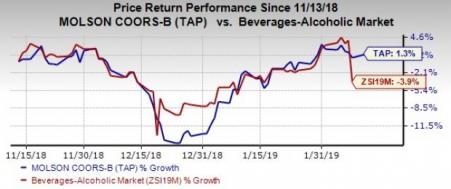
Consequently, shares of Molson Coors declined nearly 5.1% in the pre-market trading session. However, shares of this Zacks Rank #3 (Hold) company have gained 1.3% in the past three months against the industry’s 3.9% decline.
Delving Deeper
Molson Coors’ underlying adjusted earnings of 84 cents per share rose about 35.5% year over year and surpassed the Zacks Consensus Estimate of 78 cents. The increase was attributed to positive global net pricing, increase in brand volume and base business performance in Europe and International, optimization of global marketing, lower G&A expenses, cost savings, lower interest expenses and reduced income tax expenses. This was partly negated by soft volume and cost inflation in the United States and Canada.
Molson Coors Brewing Company Price, Consensus and EPS Surprise
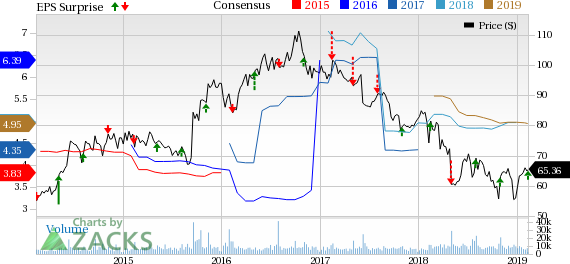
Molson Coors Brewing Company Price, Consensus and EPS Surprise | Molson Coors Brewing Company Quote
The aforementioned factors, except for lower interest expenses and reduced income tax expenses, also drove the company’s underlying EBITDA. Underlying EBITDA was $487.7 million, reflecting an increase of 1.4% from the year-ago period. Further, underlying EBITDA rose 3.9% in constant currency.
Net sales declined 6.2% to $2,418.7 million, missing the Zacks Consensus Estimate of $2,530 million. The top-line miss can be attributed to lower volume in the United States and Canada, partly negated by higher pricing. On a constant-currency basis, net sales grew 5%.
Notably, net sales per hectoliter inched up 0.3% on a reported financial-volume basis. However, net sales per hectoliter on brand-volume basis declined 0.4% in constant currency, owing to unfavorable sales mix across segments. This was partly offset by increased pricing. Excluding the impact of the new revenue recognition accounting standard, net sales per hectoliter (brand-volume basis) was down 0.3%.
Molson Coors’ worldwide brand volume declined 1.5% to 22 million hectoliters due to soft volume in the United States and Canada, offset by the strength in Europe and International businesses. Global priority brand volume dipped 1.7% while financial volume declined 6.5% to 21.6 million hectoliters. Financial volume was hurt by volume decline in the United States due to the timing of wholesaler inventories, alongside soft volume in Canada and International. This was partly compensated by volume growth in Europe.
Segmental Details
The company operates through the following geographical segments.
Canada: Molson Coors’ Canada net sales dipped 8.8% to $322 million. Net sales per hectoliter (brand-volume basis) slipped 0.7% in local currency due to the adoption of the new revenue accounting standard. Further, Canada brand volume fell 2% on account of volume constraints in the West and Ontario, offset by growth in Quebec. Meanwhile, financial volume decreased 5.7%, owing to soft contract manufacturing and brand volume as well as distributor inventory reductions. Underlying EBITDA declined 12% to $64.7 million.
United States: Molson Coors now has complete ownership rights to all the brands in the MillerCoors portfolio for the U.S. market. Net sales for the segment decreased 7% to $1,603.8 million. Domestic net sales per hectoliter (on a brand-volume basis), which excludes contract brewing and company-owned-distributor sales, improved 2.7%.
Excluding the new revenue accounting standard, net sales per hectoliter (on brand volume) increased 2.1%. The upside stemmed from favorable pricing, which was partly countered by a negative mix.
However, U.S. brand volume decreased 5.1%, accountable to soft premium light and economy segment volumes. Sales-to-wholesalers volumes (STWs), excluding contract brewing, declined 8.9% on account of lower brand volume and quarterly timing of wholesaler inventories. Nonetheless, the segment’s underlying EBITDA grew 6.4% to $370.1 million.
Europe: The segment reported net sales decline of 1.9% to $464.3 million. Europe net sales per hectoliter (brand-volume basis) fell 2.5% in local currency due to negative pricing, resulting from the adoption of the new excise-tax guidelines in one of the company’s European markets and higher investment in First Choice Agenda this year.
Europe brand volume rose 3.3%, courtesy of growth in above-premium and core brands. Financial volume increased 3%. Underlying EBITDA declined 7.8% year over year to $80.7 million.
International: Net sales for the segment declined 19.2% to $57.7 million. Net sales per hectoliter, on a brand-volume basis, declined 20.2%, owing to unfavorable sales mix and shifting to local production in Mexico. This was partly negated by positive pricing. Further, International brand volume inched up 1.1%, backed by organic growth in focus markets. The segment’s underlying EBITDA was $2.8 million versus $0.4 million in the year-ago period.
Other Financial Updates
Molson Coors ended the year with cash and cash equivalents of $1,058 million and total debt of $10,488 million. This resulted in net debt of $9,430 million as of Dec 31, 2018.
Net cash from operating activities for 2018 was $2.3 billion, which marks a significant improvement from the year-ago period. The company generated underlying free cash flow of $1.4 billion.
In 2018, the company generated $240 million of cost savings, bringing the total cost savings under the current program to $495 million.
Outlook
Management outlined the guidance for 2019. Molson Coors anticipates generating cost savings of roughly $205 million in 2019, remaining on track with the target of generating total cost savings of $700 million for the 2017-2019 period. In 2019, the company expects to deliver underlying free cash flow of around $1.4 billion (plus or minus 10%).
Capital spending is expected to be roughly $670 million (plus or minus 10%). Underlying tax rate for the year is likely to be 18-22%. Additionally, net interest expenses are projected to be $300 million (plus or minus 5%).
Further, the company estimates double-digit percentage increase for underlying EBITDA in constant currency for the International business.
It plans to reinstitute a dividend payout target of 20-25% of annual trailing underlying EBITDA upon achieving 3.75x leverage, which is likely to occur by the middle of 2019.
Don’t Miss These Better-Ranked Beverage Stocks
Diageo (LON:DGE) plc (NYSE:DEO) , with long-term earnings per share growth rate of 8.4%, currently carries a Zacks Rank #2 (Buy). You can see the complete list of today’s Zacks #1 Rank (Strong Buy) stocks here.
Carlsberg (CO:CARLa) AS (OTC:CABGY) , with long-term earnings per share growth rate of 5%, presently carries a Zacks Rank #2.
Monster Beverage Corporation (NASDAQ:MNST) , with long-term earnings per share growth rate of 16%, currently carries a Zacks Rank #2.
Zacks' Best Stock-Picking Strategy
It's hard to believe, even for us at Zacks. But from 2000-2018, while the market gained +4.8% per year, our top stock-picking strategy averaged +54.3% per year.
How has that screen done lately? From 2017-2018, it sextupled the market's +15.8% gain with a soaring +98.3% return.
Free – See the Stocks It Turned Up for Today >>
Diageo plc (DEO): Free Stock Analysis Report
Carlsberg AS (CABGY): Free Stock Analysis Report
Molson Coors Brewing Company (TAP): Free Stock Analysis Report
Monster Beverage Corporation (MNST): Get Free Report
Original post
Zacks Investment Research