Analyzing history as a guide to the future is riddled with caveats, but if you’re mindful of the limitations there’s a mother lode of perspective waiting to be mined in the cause of modeling relationships in macro and markets. One of the more useful techniques in this corner: impulse-response (IR) simulations by way of vector autoregression (VAR) modeling. As econometric applications go, this is a powerful tool for developing perspective on a recurring question in all things economic and financial: What could happen to y if x changes by z percent?
There are several ways we can search for an answer, including a simple regression model. But the flexibility and power of a VAR-based IR simulation presents a number of benefits over the usual suspects. Rasim Jafarov, an economist at Dundee Capital Markets in Toronto, tells The Capital Spectator that VAR modeling via IR simulation is especially useful when the analysis is focused on exploring dynamic relationships with feedback effects:
Unlike a simple structural regression model, where the relationship between dependent and independent variables is assumed static, the VAR modeling offers a more dynamic (behavioristic) approach to the nature of interaction between variables via a system of autoregressive equations. The advantage of this system is that it is able to estimate the impact of changes in one variable on the other variable not only at a point of time, but also over period of time.
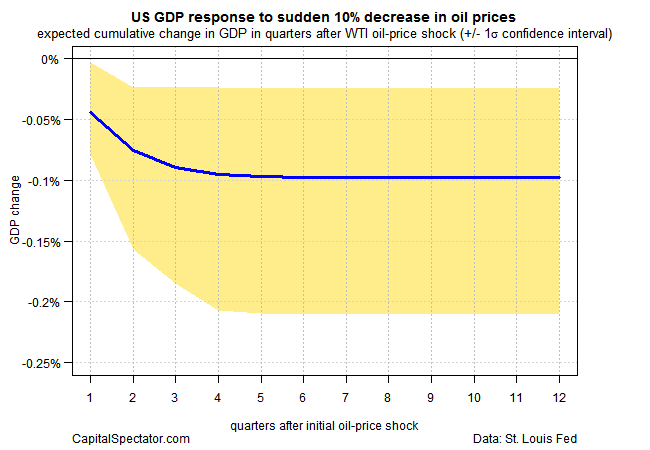
Even better, we can easily run the necessary calculations in R via the vars package. As a simple example, let’s update an idea previously outlined in one of Dundee’s recent research notes (“The Impact of Lower Oil Prices on the Canadian and US Economies,” Nov. 5, 2014). This time we’ll model the impact of a 10% increase in oil prices—a price “shock”—on the US economy. It’s no surprise to find that the model projects a slight reduction in economic activity–a roughly 0.1% decline in GDP in subsequent quarters following a sudden 10% jump in oil’s price (based on the point forecast as shown by the blue line).

Note that the chart above reflects analysis for data from 1971 through 2015. Given the volatility in oil prices lately, along with dramatic changes in supply capacity due to new technologies, it’s reasonable to wonder if the historical record has changed. One way to probe that idea is to analyze the relationship between GDP and oil prices in recent history and compare the results for earlier periods.
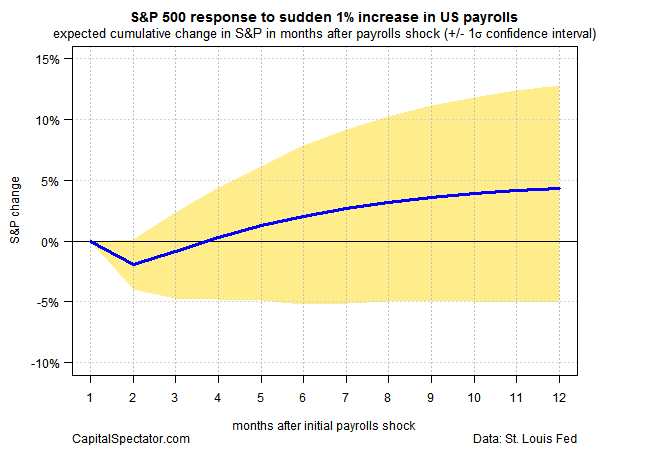
Let’s move on and consider another relationship: payrolls and the stock market. Intuition implies that a stronger labor market is good news for equity prices. To test the idea, let’s run a VAR-based IR analysis on the S&P 500 and US nonfarm payrolls. The procedure in this test starts by generating VAR regressions on the stock market in connection with payrolls and three other key US economic indicators for the 1999-2015 period: industrial production, personal income, and personal consumption expenditures. Using that relationship as a guide, the next step is modeling the impact on equities based on a 1% increase in payrolls. The result, shown in the next chart below, suggests that the “shock” will boost the stock market by nearly 5% after three years. To be precise, that’s a 5% increase over and above any gains (or losses) that unfold without a 1% increase in payrolls.

Modeling the future is an imprecise business that’s prone to error, of course, and so every modeling projection should be read with a healthy dose of skepticism. Nonetheless, using VAR to estimate expected shifts is a robust framework for developing context about what could happen. It’s not a silver bullet, but running this flavor of quantitative scenario analysis can be useful as a reality check on projections formulated with other techniques.
Disclosure: Originally published at Saxo Bank TradingFloor.com
