
We are in the thick of earnings season, and so far the general trend has been as anticipated: modest if any top-line growth and more earnings beats than misses (albeit versus a low bar). But forward guidance has been the big decider on how the stock trades post-earnings, and the message has been decidedly mixed, as many companies have had to reduce guidance or otherwise failed to make the grade in other important growth metrics. Nevertheless, the bulls are firmly in charge, and the S&P 500 continues to set new all-time highs this week as it challenges yet another psychological resistance level at 1700.
Notable earnings winners this week have included Apple (AAPL), Boeing (BA), General Electric (GE) and Ford (F), Eli Lilly (LLY), Delta Air Lines (DAL), Meritage Homes (MTH), Western Digital (WDC), Facebook (FB), and Visa (V). Losers have included names like Broadcom (BRCM), Motorola Solutions (MSI), and bellwethers Caterpillar (CAT) and McDonald's (MCD).
Netflix (NFLX) is a notable example of a firm that impressively surpassed estimates but still got killed due to disappointment in another key growth metric, which in this case was subscriber growth, even after rolling out some hot new content.
The Federal Reserve has provided strong support to earnings growth by reducing the cost of borrowing through a low Fed funds rate and quantitative easing in the form of bond purchases further out the maturity spectrum to keep longer-term rates low. Now of course, the big worry is the impact of the inevitable rise in longer-term borrowing costs as “tapering” on bond purchases (and perhaps even unwinding) begins, even if the Fed funds rate remains low. The universal consensus is that interest rates are going up. But markets have a way of fooling the majority, so I’m not so sure high rates are in the cards any time soon.
If rates are allowed to rise too much, the fragile economy will be severely hindered. Corporate borrowing costs will rise, which will hurt earnings, buybacks, expansion, and job growth. Mortgage rates will rise, which will reduce affordability and stifle the housing recovery, which is important for both the consumer wealth effect and construction jobs. Also, it would worsen the immense government budget deficits and pension liabilities at all levels -- from the Federal government to the states, to the cities, and all the way down to the individual municipal districts (e.g., water, schools, utilities, and any group authorized to issue bonds). So far, eight US cities have filed for bankruptcy, with Detroit the most notable, and there are nearly 30 municipal districts that have already filed. Surely there are more of both in the cards.
Looking at the chart of the SPDR S&P 500 Trust (SPY), it closed Wednesday at 168.52 after setting a new all-time intraday high of 169.86, and it is now tantalizingly close to breaking through the 170 barrier. SPY remains above all its major moving averages and the uptrend line from November. Oscillators RSI, MACD, and Slow Stochastic are all looking ready to roll over, but there is a lot of strong support nearby in the form of uptrend line, moving averages, and prior levels of support.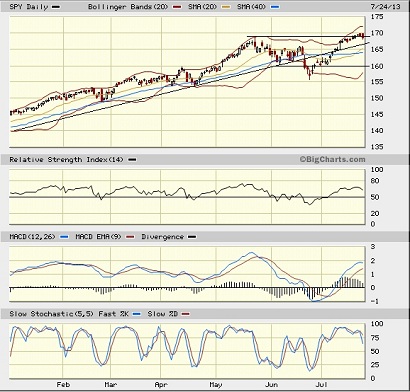
Small caps continue to look strong, like the iShares Russell 2000 ETF (IWM), and now emerging markets have recovered nicely, as well, thanks to an improving outlook in China. The iShares MSCI Emerging Markets ETF (EEM) has made a very nice bounce back above its important 50-day simple moving average. Let’s see if it can hold it.
As the markets push for new highs, it’s no surprise that the CBOE Market Volatility Index (VIX), a.k.a. “fear gauge,” remains historically low. It closed Wednesday at 13.18, which keeps it in the zone of high complacency below 15 that we saw for most of the earlier part of the year.
Latest rankings: The table ranks each of the ten U.S. business sector iShares ETFs by Sabrient's proprietary Outlook Score, which employs a forward-looking, fundamentals-based, quantitative algorithm to create a bottom-up composite profile of the constituent stocks within the ETF. The multi-factor model considers forward valuation, historical earnings trends, earnings growth prospects, the dynamics of Wall Street analysts' consensus estimates, accounting practices and earnings quality, and various return ratios. In addition, the table also shows Sabrient's proprietary Bull Score and Bear Score for each ETF.
High Bull score indicates that stocks within the ETF have tended recently toward relative outperformance during particularly strong market periods, while a high Bear score indicates that stocks within the ETF have tended to hold up relatively well during particularly weak market periods. Bull and Bear are backward-looking indicators of recent sentiment trend.
As a group, these three scores can be quite helpful for positioning a portfolio for a given set of anticipated market conditions.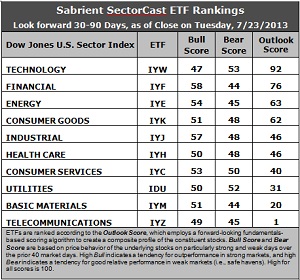
Observations:
1. Technology (IYW) remains in the top spot with a robust Outlook score of 92, as scores have changed very little this week. Stocks within IYW display a low forward P/E, a solid long-term projected growth rate, and the best return ratios. Financial (IYF) to take the second spot again with a score of 76 as stocks within IYF enjoy the best Wall Street support, a low forward P/E, and strong insider sentiment. Wall Street analysts have lightened up on their earnings downgrades across the board, and the biggest improvement this week is in Energy (IYE), which vaulted from seventh place to the third spot this week with an Outlook score of 63. IYE enjoys the lowest forward P/E.
2. Telecom (IYZ) stays in the cellar yet again with an Outlook score of 1. Stocks within IYZ are generally weak in all other factors, including a high forward P/E, low long-term projected growth, and poor return ratios. They also got some sell-side downgrades this week. Also in the bottom two again this week is Basic Materials (IYM) with a score of 20, although stocks within this sector were not hammered quite so hard by Wall Street.
3. This week’s fundamentals-based rankings are looking a bit more bullish, with Technology, Financial, Energy, and Industrial all in the top five. I’m still looking for more strength in Consumer Services (IYC) to go with its leading score in long-term projected growth.
4. Looking at the Bull scores, IYF has been the leader on particularly strong market days, scoring 58, followed closely by IYJ, while Technology (IYW) surprisingly scores the lowest at 47. Defensive sector Utilities (IDU) is scoring surprisingly well. The top-bottom spread is still a narrow 11 points, indicating relatively high sector correlations, which indicates more of a “risk-on/risk-off” approach in which all boats are lifted together, rather than a thoughtful stock-picking approach.
5. Looking at the Bear scores, IYW remains the surprising favorite “safe haven” on weak market days, scoring 53, which is well ahead of defensive sectors like Utilities (IDU), but is not anywhere near the usual high in Bear scores of around 65-70 that we’ve often seen in IDU. IYF and Basic Materials (IYM) share the worst performance during extreme market weakness as reflected in the low Bear score of 44. The top-bottom spread is again only 9 points, which indicates high sector correlations on weak market days.
6. Overall, Technology (IYW) shows the best all-weather combination of Outlook/Bull/Bear scores. Adding up the three scores gives a total of 192. Telecom (IYM) is the by far the worst at 95. Looking at just the Bull/Bear combination, Industrial (IYJ) displays the highest score of 105, which indicates good relative performance in extreme market conditions (whether bullish or bearish), while Telecom (IYZ) scores the lowest at 94, which indicates investor avoidance during extreme conditions.
These Outlook scores represent the view that Technology and Financial sectors may be relatively undervalued, while Telecom and Basic Materials sectors may be relatively overvalued based on our 1-3 month forward look.
Some top-ranked stocks within IYW and IYF include CommVault Systems (CVLT), Apple (AAPL), Signature Bank New York (SBNY), and Goldman Sachs (GS). Each of these also displays a solid score in our new Earnings Quality Rank (EQR), which is a pure accounting-based risk assessment signal that has proven valuable for both fundamental screening and as an orthogonal alpha factor for quant models. It was co-developed by Sabrient and subsidiary Gradient Analytics, a forensic accounting firm.
Disclosure: Author has no positions in stocks or ETFs mentioned.
About SectorCast: Rankings are based on Sabrient’s SectorCast model, which builds a composite profile of each equity ETF based on bottom-up aggregate scoring of the constituent stocks. The Outlook Score employs a fundamentals-based multi-factor approach considering forward valuation, earnings growth prospects, Wall Street analysts’ consensus revisions, accounting practices, and various return ratios. It has tested to be highly predictive for identifying the best (most undervalued) and worst (most overvalued) sectors, with a 1-3 month forward look.
Bull Score and Bear Score are based on the price behavior of the underlying stocks on particularly strong and weak days during the prior 40 market days. They reflect investor sentiment toward the stocks (on a relative basis) as either aggressive plays or safe havens. So, a high Bull score indicates that stocks within the ETF have tended recently toward relative outperformance during particularly strong market periods, while a high Bear score indicates that stocks within the ETF have tended to hold up relatively well during particularly weak market periods.
Thus, ETFs with high Bull scores generally perform better when the market is hot, ETFs with high Bear scores generally perform better when the market is weak, and ETFs with high Outlook scores generally perform well over time in various market conditions.
Of course, each ETF has a unique set of constituent stocks, so the sectors represented will score differently depending upon which set of ETFs is used. For Sector Detector, I use ten iShares ETFs representing the major U.S. business sectors.
About Trading Strategies: There are various ways to trade these rankings. First, you might run a sector rotation strategy in which you buy long the top 2-4 ETFs from SectorCast-ETF, rebalancing either on a fixed schedule (e.g., monthly or quarterly) or when the rankings change significantly. Another alternative is to enhance a position in the SPDR Trust exchange-traded fund (SPY) depending upon your market bias. If you are bullish on the broad market, you can go long the SPY and enhance it with additional long positions in the top-ranked sector ETFs. Conversely, if you are bearish and short (or buy puts on) the SPY, you could also consider shorting the two lowest-ranked sector ETFs to enhance your short bias.
However, if you prefer not to bet on market direction, you could try a market-neutral, long/short trade—that is, go long (or buy call options on) the top-ranked ETFs and short (or buy put options on) the lowest-ranked ETFs. And here’s a more aggressive strategy to consider: You might trade some of the highest and lowest ranked stocks from within those top and bottom-ranked ETFs.
- English (UK)
- English (India)
- English (Canada)
- English (Australia)
- English (South Africa)
- English (Philippines)
- English (Nigeria)
- Deutsch
- Español (España)
- Español (México)
- Français
- Italiano
- Nederlands
- Português (Portugal)
- Polski
- Português (Brasil)
- Русский
- Türkçe
- العربية
- Ελληνικά
- Svenska
- Suomi
- עברית
- 日本語
- 한국어
- 简体中文
- 繁體中文
- Bahasa Indonesia
- Bahasa Melayu
- ไทย
- Tiếng Việt
- हिंदी
Mixed Messages Abound Among Earnings Reports
Published 07/25/2013, 07:18 AM
Updated 07/09/2023, 06:31 AM
Mixed Messages Abound Among Earnings Reports
3rd party Ad. Not an offer or recommendation by Investing.com. See disclosure here or
remove ads
.
Latest comments
Install Our App
Risk Disclosure: Trading in financial instruments and/or cryptocurrencies involves high risks including the risk of losing some, or all, of your investment amount, and may not be suitable for all investors. Prices of cryptocurrencies are extremely volatile and may be affected by external factors such as financial, regulatory or political events. Trading on margin increases the financial risks.
Before deciding to trade in financial instrument or cryptocurrencies you should be fully informed of the risks and costs associated with trading the financial markets, carefully consider your investment objectives, level of experience, and risk appetite, and seek professional advice where needed.
Fusion Media would like to remind you that the data contained in this website is not necessarily real-time nor accurate. The data and prices on the website are not necessarily provided by any market or exchange, but may be provided by market makers, and so prices may not be accurate and may differ from the actual price at any given market, meaning prices are indicative and not appropriate for trading purposes. Fusion Media and any provider of the data contained in this website will not accept liability for any loss or damage as a result of your trading, or your reliance on the information contained within this website.
It is prohibited to use, store, reproduce, display, modify, transmit or distribute the data contained in this website without the explicit prior written permission of Fusion Media and/or the data provider. All intellectual property rights are reserved by the providers and/or the exchange providing the data contained in this website.
Fusion Media may be compensated by the advertisers that appear on the website, based on your interaction with the advertisements or advertisers.
© 2007-2024 - Fusion Media Limited. All Rights Reserved.