The FOMC minutes released yesterday afternoon were the real player across the commodity complex as all indications point to a greater chance of a June rate hike than previously considered. Strong US dollar action put pressure on the equities and energies as most analysts are now leaning toward a possible second rate hike since the FOMC eased all the way to zero interest rates over the past 8 years. The idea of tighter monetary policy has had the effect of a stronger US dollar due to inflation has normally sent shock waves cross the equity indices as investors fear that less money supply will have adverse economic effects. While the pull back in equities was considerable at one point in today’s session with the S&P 500 down nearly 20 handles at the low, we have seen it rebound as the effect of higher rates seem to be having a waning effect on volatility.
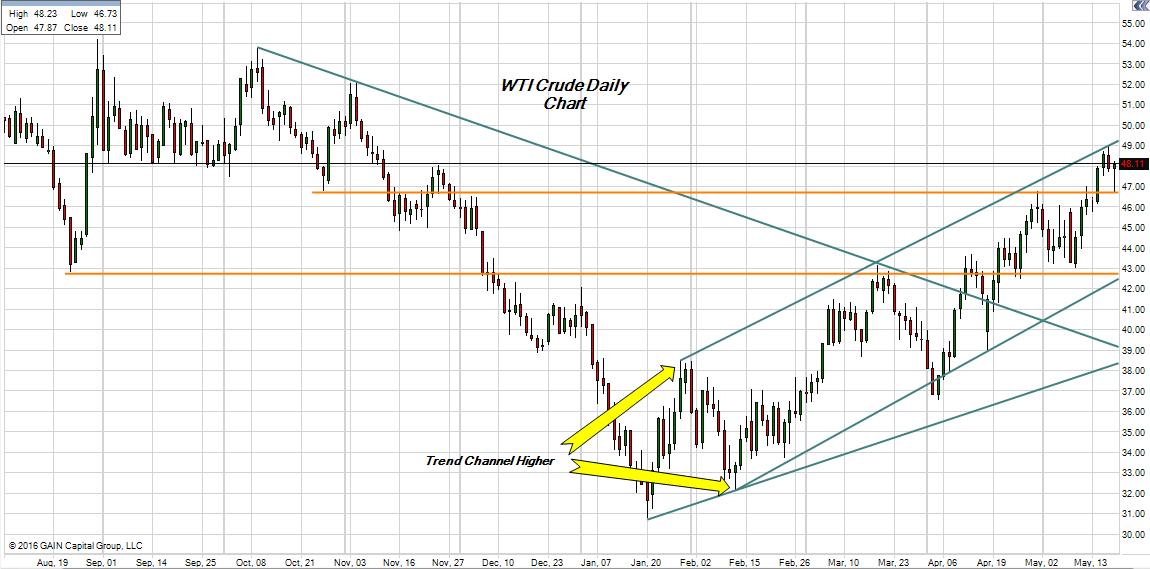
The same can be said for the energy complex, which saw a slide in prices due to the same fears of higher rates and economic slowing. The selloff was met with strong buying off the lows as particular crude fundamentals featuring daily production draws out of Canada and Nigeria maintained the bull move higher. In fact, the technical support in the front month crude contract was met to virtually the penny as the trend channel higher remain intact and in control of the price discovery (see Chart A).
Inventories for the crude complex remain mildly mixed with slightly bullish tone in the refined products and slightly bearish tone in the WTI. While there is plenty of supply around, the idea that there could be some ebb in the available stocks has given the price action a decidedly bullish sentiment. With lessening global demand concerns following better economic data and the revealing Fed minutes the market seems poised to continue trading higher with the now months long channel higher. Some significant violation to the down side channel formation would be needed driven by bearish developments fundamentally to see any rationale for substantially lower pricing. This phenomena seems to be replicated across a wide swath of commodity products.
(Chart A)

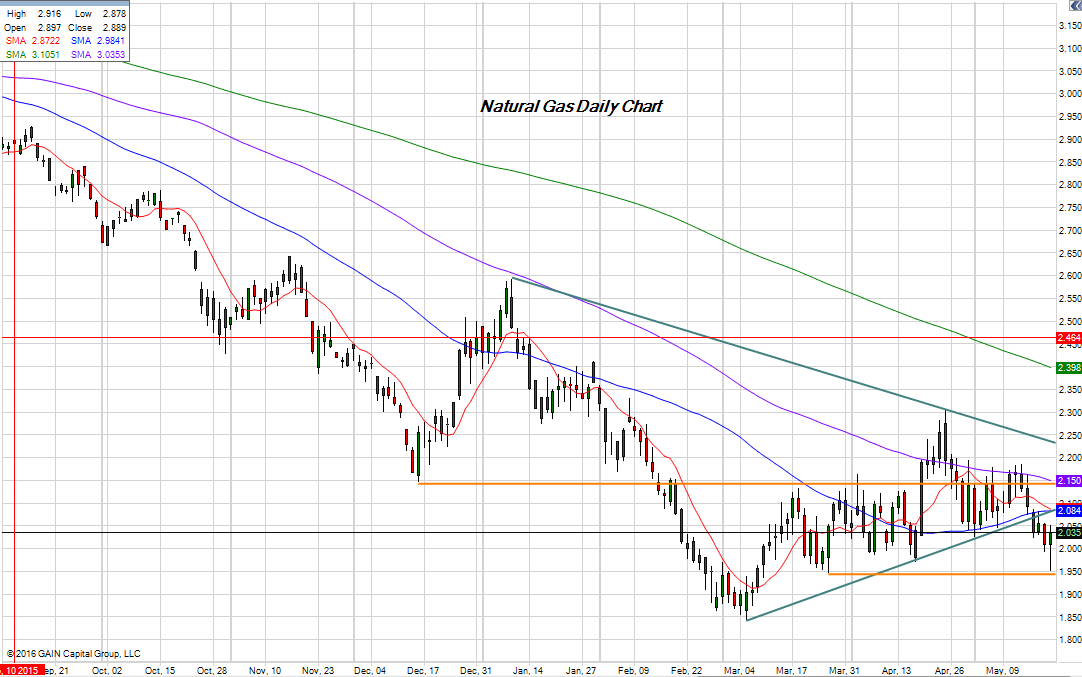
The natural gas market has gone away from the fundamentals for the most part as well as the technical triggers appear to be driving the market almost exclusively. Unlike the crude market however, the natural gas continues to flirt with the down side support levels and continues to remain below trend line resistance following last week’s violation of that very support. The market did sell off on today’s less than expected inventory build (73 BCF vs EXP 78 BCF build) and traded very near to the key pivot support at just under 1.95 (the low in the June contract was 1.952) before bouncing back above 2 dollars again. Potential warmer weather than has been the norm of late in the Midwest and eastern coast could clear the way for lower trading off of the technical developments above the current price (see chart B).
(Chart B)

Trading commodity futures and options involves substantial risk of loss and may not be suitable for all investors.
