The U.S. Nonfarm Payrolls came out Friday morning with the U.S. economy adding 128,000 jobs to the economy, beating expectations of 89,000. October’s numbers were revised higher as well, from 136,000 to 180,000. The revision makes October’s headline data even stronger. The inflation component was just as strong. Although the headline Average Hourly Earnings number was a slight miss at 0.2% vs. 0.3% expected while September’s number was revised from 0% to 0.4%.
Although this data is strong, the next Fed meeting isn’t until mid-December
Contrary to the NFP data, the ISM Manufacturing PMI for October came in slightly worse at 48.3 vs. 48.9 expected and 47.8 last. Below 50 means that the economy is contracting. This is the third straight month of contraction. Even more worrisome is the ISM Manufacturing Price Index, which fell to 45.5 vs expectation of 49.9 and 49.7 last.
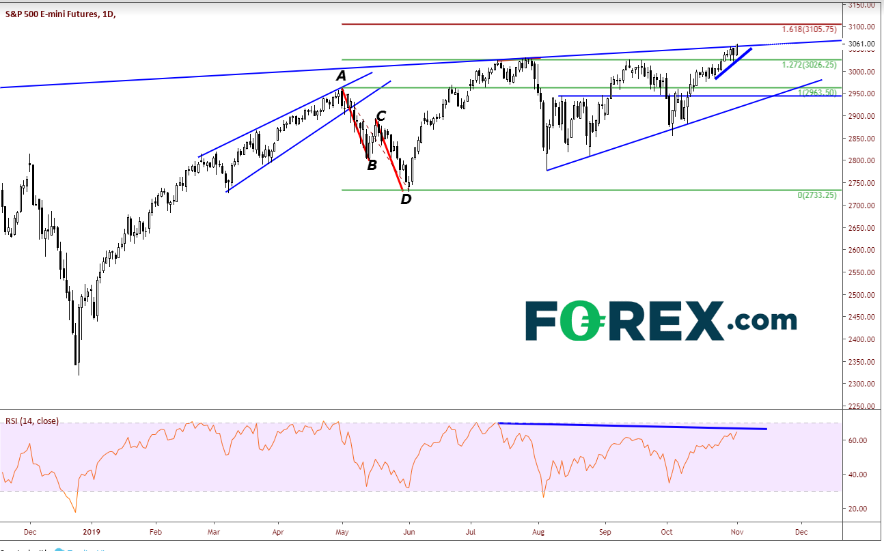
So, the data on the day was mixed – better employment, weaker manufacturing, mixed inflation. According to the FedWatch Tool, there is currently only a 14% chance of a rate cut at the December 11 meeting. However, there is a lot of data remaining, including November’s data for NFP and ISM. The stock market doesn’t appear to be concerned about the ISM data, as the S&P 500 Futures has been putting in all-time new highs above 3060 following Friday's data dump.

Source: Tradingview, CME, FOREX.com
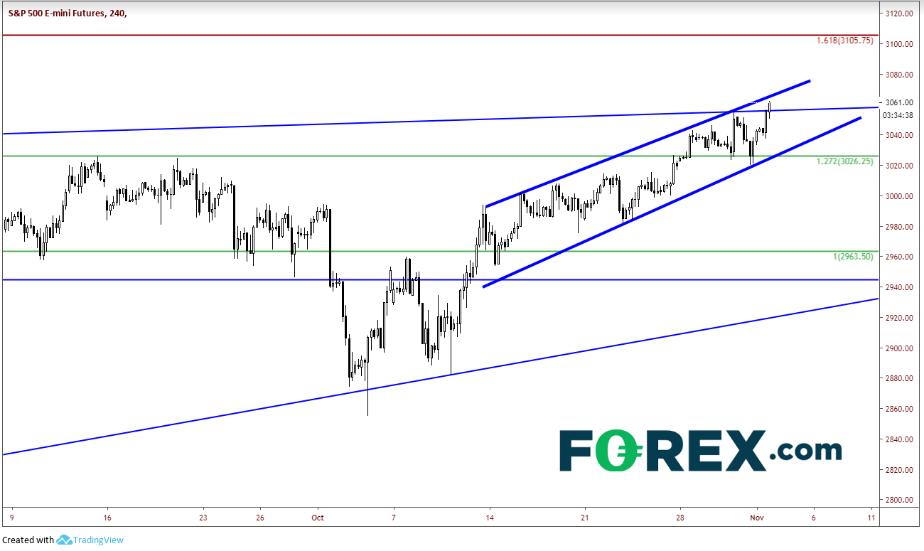
Not to beat a dead horse, but as stocks continue to put in all-time highs, it is tough not to write about them. As S&P breaks through its long-term upward sloping trendline dating back to October of last year, the next resistance is the shorter-term upward sloping channel line from October 1 near 3066. Above that S&P has room to run to 3105, which is the 161.8% Fibonacci extension from the May 1 high to the June 3 low. Horizontal support comes in near 3045. Next level is the bottom of the channel trendline at 3027.

Source: Tradingview, CME, FOREX.com
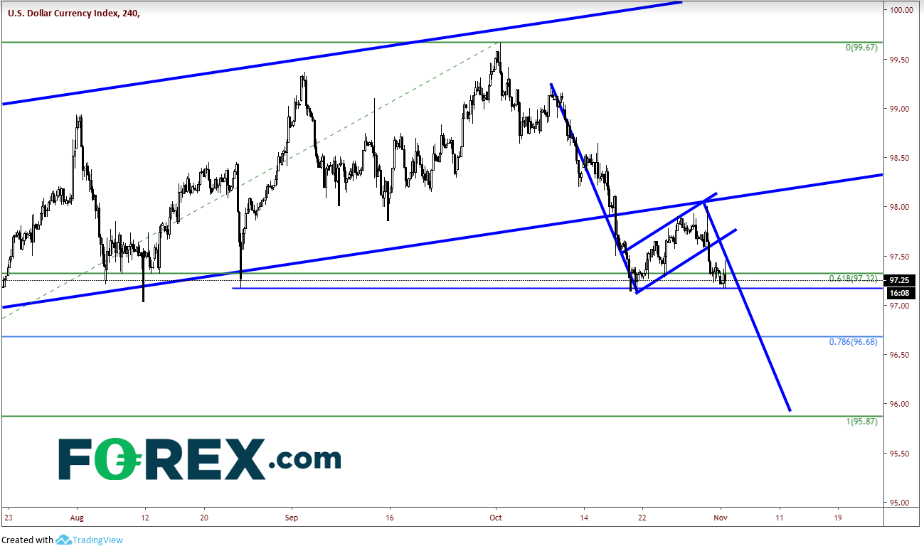
With the bid on stocks, the DXY traded lower on the day and was testing previous lows near 97.14. The selloff from October 8 looks like it may have formed a flag pattern, with a target near 96. If price breaks through 97.14, the next level of support is 96.69, which is the 78.6% retracement from the lows in June to the October 1 high. Below that, support is the June low at 95.87. Resistance is the bottom trendline of the flag pattern near 97.70 and above that the longer-term trendline and top of the flag near 98.10.

Source: Tradingview, FOREX.com
