Get 40% Off
🤯 Perficient is up a mind-blowing 53%. Our ProPicks AI saw the buying opportunity in March.Read full update

Miners Should Prepare A Pillow: Gold's Hard Landing May Hurt

Published 01/07/2022, 10:22 AM

As in sports, a weak market streak can reverse in the next season. However, the precious metals team looks like it’s about to drop out of the league. While gold, silver, and mining stocks were in the holiday spirit during the final weeks of 2021, I warned on Jan. 4 that the Junior Gold Miners ETF's (NYSE:GDXJ) sleigh was headed for an epic crash. I wrote:

The GDXJ ETF’s corrective upswing has likely run its course. Interestingly, the junior miners’ current rally mirrors the small correction that materialized in mid-2021 (early August). Back then, the GDXJ ETF rallied on low volume and didn’t recapture its 50-day moving average. With the same tepid strength present today, the drawdown that followed in mid-2021 will likely commence once again.

For context, I highlighted the similarities with the green and purple ellipses below. On top of that, the GDXJ ETF’s RSI behavior is also similar – with the indicator moving from roughly 30 to 50. Also noteworthy, similar developments occurred in February/March 2020, before the profound plunge unfolded. As a result, the GDXJ ETF looks set for another sharp drawdown over the medium term.

After the junior mining stocks ETF proceeded to decline by more than 6% in two days, my short position rang in the New Year with solid gains. What’s more, with the GDXJ ETF likely to break below its 2021 lows over the medium term, winter woes should materialize before a long-term buying opportunity emerges.

Please see below:

3rd party Ad. Not an offer or recommendation by Investing.com. See disclosure here or remove ads .

GDXJ Daily Chart.

Likewise, with the GDX (NYSE:GDX) ETF’s RSI (Relative Strength Index) signaling an ominous outcome for the senior miners, I warned that a sell-off was likely on the horizon. For context, I highlighted the historical similarities with the blue vertical dashed lines below.

Moreover, with the GDX ETF’s weakness accelerating on Jan. 5/6, the senior miners have declined sharply in recent days. In addition, the current price action mirrors the senior miners’ ominous performance in July/August 2021 – just like I’ve been describing it for a few weeks now. As a result, the previous corrective upswing is likely over, and the GDX ETF should confront lower lows sooner rather than later.

For context, a breakdown below the 2021 lows should materialize over the medium term, and the forecast for gold, as well as gold stocks, is bearish for the next several weeks / months. However, the milestone may not occur over the next few days.

GDX Daily Chart.

Turning to the HUI Index’s long-term chart, the same bearish signals are present. For example, I marked the specific tops with red and black arrows. In the current situation, we saw yet another small move up, but that’s most likely because the price moves are now less volatile. The areas marked with red ellipses remain similar and show back-and-forth movement before the big decline.

As such, while we’ve entered a consolidation phase, this week’s selling pressure has been quite ferocious. Thus, the implications are not bullish but bearish.

HUI Weekly Chart.

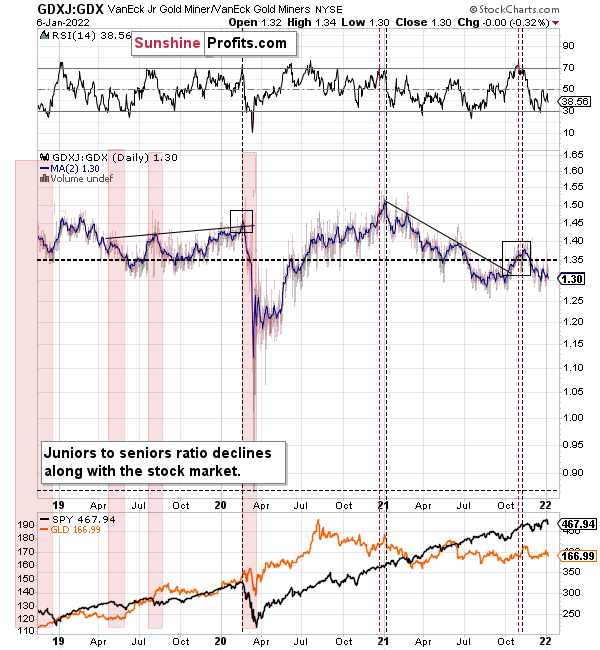
Finally, the GDX/GDXJ ratio continues to perform as expected. For example, I warned throughout 2021 that the ratio was destined for devaluation. ith the metric kicking off 2022 with another decline, the GDXJ ETF continues to underperform the GDX ETF.

3rd party Ad. Not an offer or recommendation by Investing.com. See disclosure here or remove ads .

For context, I believe that gold, silver, and the GDX ETF are all ripe for sharp re-ratings over the medium term. However, I think that the GDXJ ETF offers the best risk-reward ratio due to its propensity to materially underperform during bear markets. As a result, shorting junior miners offers a great risk to reward trade-off.

In conclusion, gold, silver, and mining stocks began 2022 with the same weakness that plagued them in 2021. While the worst performers one year often become the best performers the next, the charts signal more weakness ahead. As a result, while the precious metals are poised to soar over the long term, lower lows will likely materialize before their secular uptrends resume.

Latest comments

The first time HUI closed above its current level (243.35) was on 28 November 2003. On that day, Gold closed just shy of 400$. In those days the margin (Spot Price minus All-In-Sustaining-Cost) of  the gold miners was about 100$ (AISC 305$, statista.com). Today, their margin is about 600$ or six-fold !!! Now if the HUI is going to stay where it is - or even going lower - as Radomski suggests in his bearish thesis, it would mean he expects Gold to dive to 1200$; or just 100$ above a rather pessimistic estimation of 1100$ AISC for 2022. And all this despite ultra-low interest rates, record government debt und extreme amounts of money printed ... Some people are trying to convince you that Gold and Silver are worth nothing, while hoarding it themselves at bargain prices (case in point:  JP Morgan). Don't listen to them!
Buy the physical as a store of value. Hand it down to kids. Duty free
I’ve watched so many trader go broke more than anything else trying to guess direction on natural gas and gold
Cryptos are the main reason Gold and Silver haven't had a bid.  As their euphoria declines with the market, Gold and Silver will be the beneficiaries.  It won't happen overnight but it will happen.
I only come here to read the comments.
this analyse is about old analyse. plaaaaah
Gold has been trading in a range for over year up and down so I don't know about all these "warning" you foretold? it hasn't broken through the floor it's been stuck at forever. You act like it's dropped 50%?
junior etf crash of only 6%, hardly doomsday result
Like the other author who shorted MRNA from 90 to 400
Everytime you are hilarious!
And yet again, you say south for gold and silver and they immediately bounce high ! Gold is 1800 and your ever lasting target was 900,, you are the worst analyst on the planet and everyone knows it !
He could be right this time around! Lol
If you like it or not, most of his analyses have been right in 2021
Which one's? Sounds like not Gold?
I always read his reports with a pinch of salt. high entertainment value. but with low intelligence level. sort of a disgrace to the CFA designation and his nationality
you're a disgrace to your nationality for narcissistic comments like these. Chinese and Polish are smart people. Don't know from which country are you from.
Take it easy folks , this guy is not even a real human let alone having a nationality ,, some fed propaganda machine with a fake face / name behind it , dont get fo/oled !
anyone interested in minerals
Sure, gold will be $900 and silver $9, like you predicted in April 2020 I guess... you ruined your followers then by advising to short the gold and silver miners... anyone who follows your poor advice is going broke...
spare him. he lost to much on PM. trying his best to talk it down.
I guess I won't bother reading then. glad I checked comments there are a few perma bear negative authors. Nothing wrong with being bearish but it shouldn't be 100% obsession because the market has clearly not been 100% bearish
Risk Disclosure: Trading in financial instruments and/or cryptocurrencies involves high risks including the risk of losing some, or all, of your investment amount, and may not be suitable for all investors. Prices of cryptocurrencies are extremely volatile and may be affected by external factors such as financial, regulatory or political events. Trading on margin increases the financial risks.
Before deciding to trade in financial instrument or cryptocurrencies you should be fully informed of the risks and costs associated with trading the financial markets, carefully consider your investment objectives, level of experience, and risk appetite, and seek professional advice where needed.
Fusion Media would like to remind you that the data contained in this website is not necessarily real-time nor accurate. The data and prices on the website are not necessarily provided by any market or exchange, but may be provided by market makers, and so prices may not be accurate and may differ from the actual price at any given market, meaning prices are indicative and not appropriate for trading purposes. Fusion Media and any provider of the data contained in this website will not accept liability for any loss or damage as a result of your trading, or your reliance on the information contained within this website.
It is prohibited to use, store, reproduce, display, modify, transmit or distribute the data contained in this website without the explicit prior written permission of Fusion Media and/or the data provider. All intellectual property rights are reserved by the providers and/or the exchange providing the data contained in this website.
Fusion Media may be compensated by the advertisers that appear on the website, based on your interaction with the advertisements or advertisers.
© 2007-2024 - Fusion Media Limited. All Rights Reserved.