
The University of Michigan Final Consumer Sentiment for May came in at 97.1, up from the April Final reading of 97.0. Investing.com had forecast 97.5.
Surveys of Consumers chief economist, Richard Curtin, makes the following comments:
Consumer sentiment has continued to move along the high plateau established following Trump's election. The final May figure was virtually unchanged from either earlier in May or the April reading. Indeed, the May figure was nearly identical with the December to May average of 97.3. Moreover, the partisan divide between Democrats and Republicans has also remained largely unchanged, with the first expecting a recession and the other more robust economic growth. How long will economic expectations be dominated by partisanship? Unlike differences in expectations across age, education, or income groups, which usually reflect actual differences in prospects for employment and income expectations, for example, partisanship is reflected by economic policy preferences. Since no major policies, such as healthcare, taxes, or infrastructure spending have yet been adopted, the partisan divide may reflect differences in policy preferences expressed as expected economic outcomes. Thus, the extreme partisan divide may persist until passage is deemed either inevitable or impossible. While extremes may well narrow, it is unlikely that the impact of partisanship on economic expectations will disappear. Despite the expected bounce back in spending in the current quarter, personal consumption is expected to advance by 2.3% in 2017, although this is based on averages across the political divide, which has never been as extreme as it is currently. [More...]
See the chart below for a long-term perspective on this widely watched indicator. Recessions and real GDP are included to help us evaluate the correlation between the Michigan Consumer Sentiment Index and the broader economy.
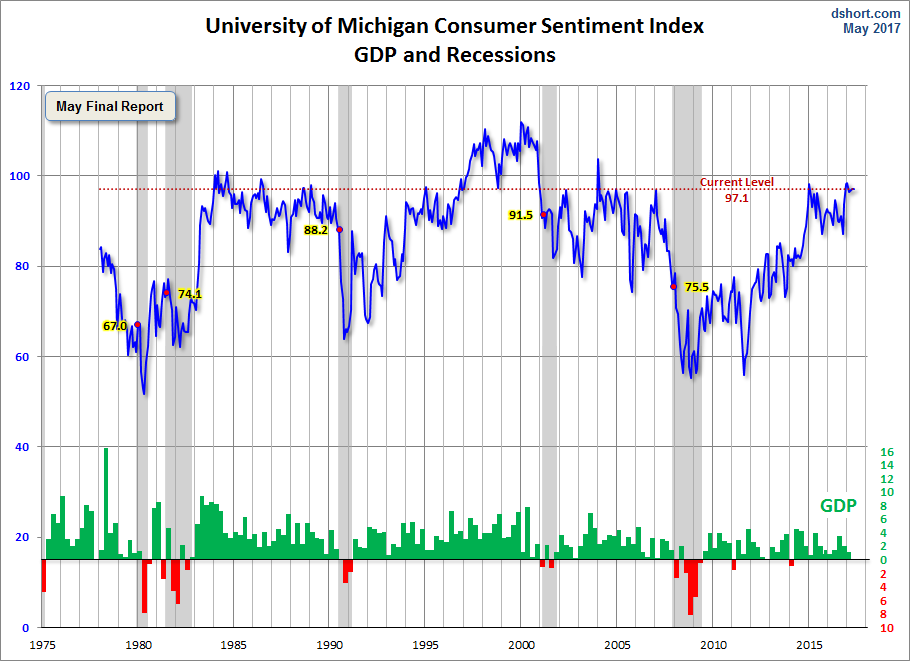
To put today's report into the larger historical context since its beginning in 1978, consumer sentiment is 13.4 percent above the average reading (arithmetic mean) and 14.8 percent above the geometric mean. The current index level is at the 86th percentile of the 473 monthly data points in this series.
The Michigan average since its inception is 85.6. During non-recessionary years the average is 87.8. The average during the five recessions is 69.3. So the latest sentiment number puts us 27.8 points above the average recession mindset and 9.3 points below the non-recession average.
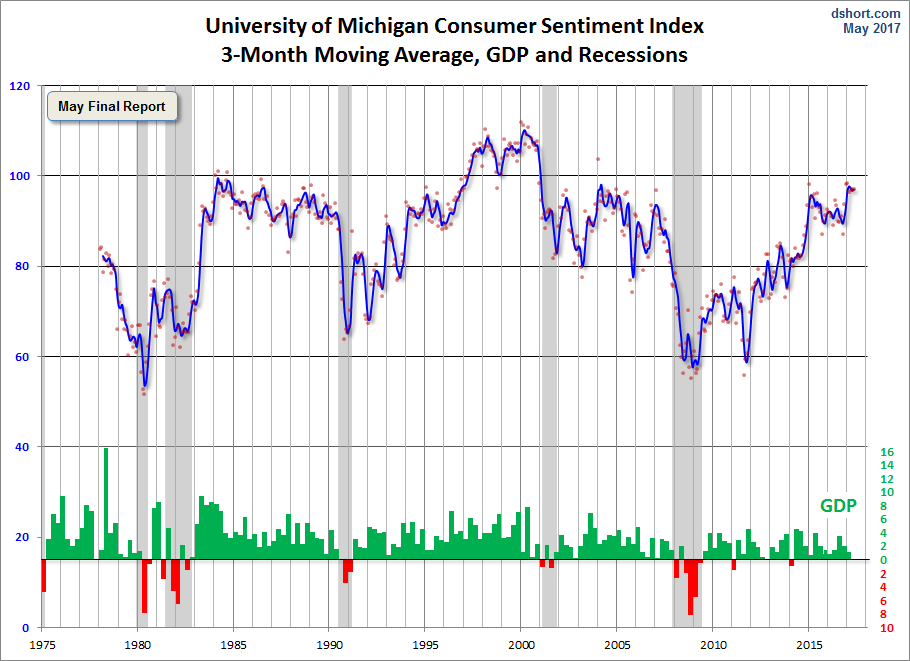
Note that this indicator is somewhat volatile, with a 3.0 point absolute average monthly change. The latest data point saw a 0.1 percent change from the previous month. For a visual sense of the volatility, here is a chart with the monthly data and a three-month moving average.
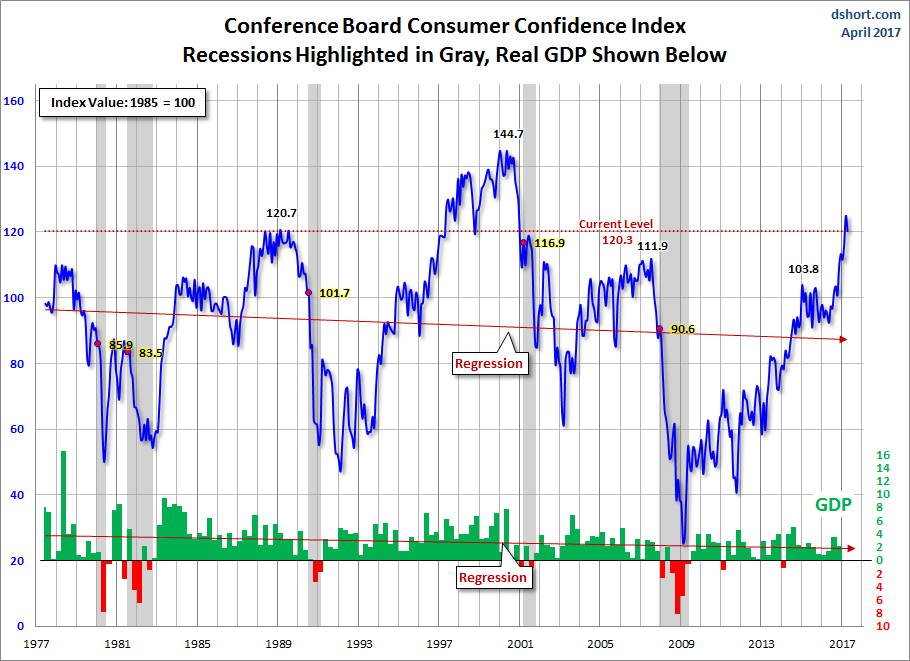
For the sake of comparison, here is a chart of the Conference Board's Consumer Confidence Index (monthly update here). The Conference Board Index is the more volatile of the two, but the broad pattern and general trends have been remarkably similar to the Michigan Index.
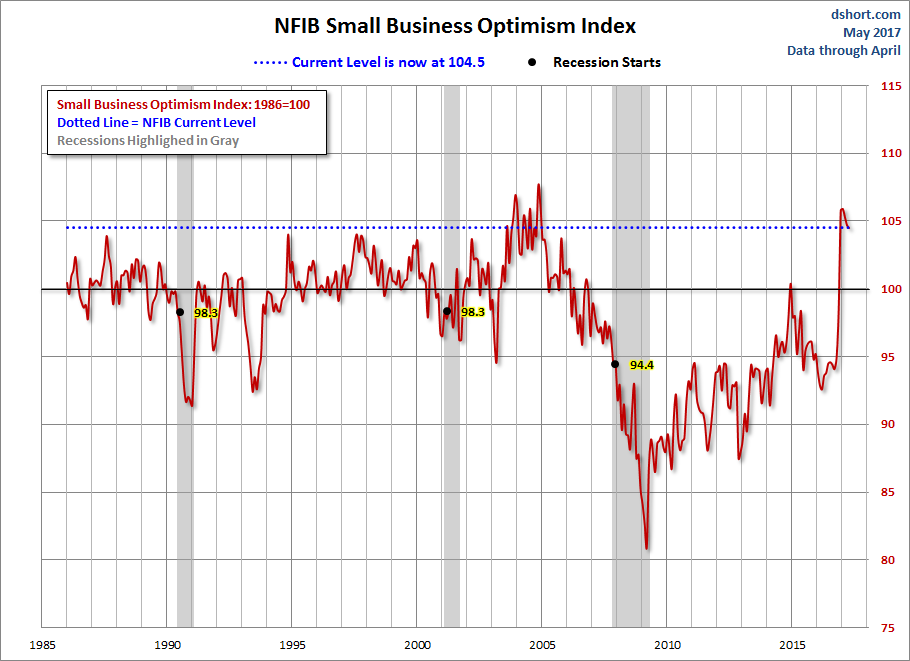
And finally, the prevailing mood of the Michigan survey is also similar to the mood of small business owners, as captured by the NFIB Business Optimism Index (monthly update here).
The general trend in the Michigan Sentiment Index since the Financial Crisis lows has been one of slow improvement.The survey findings since December 2015 saw gradual decline followed by a bounceback later in the year with its interim peak in January of 2017.