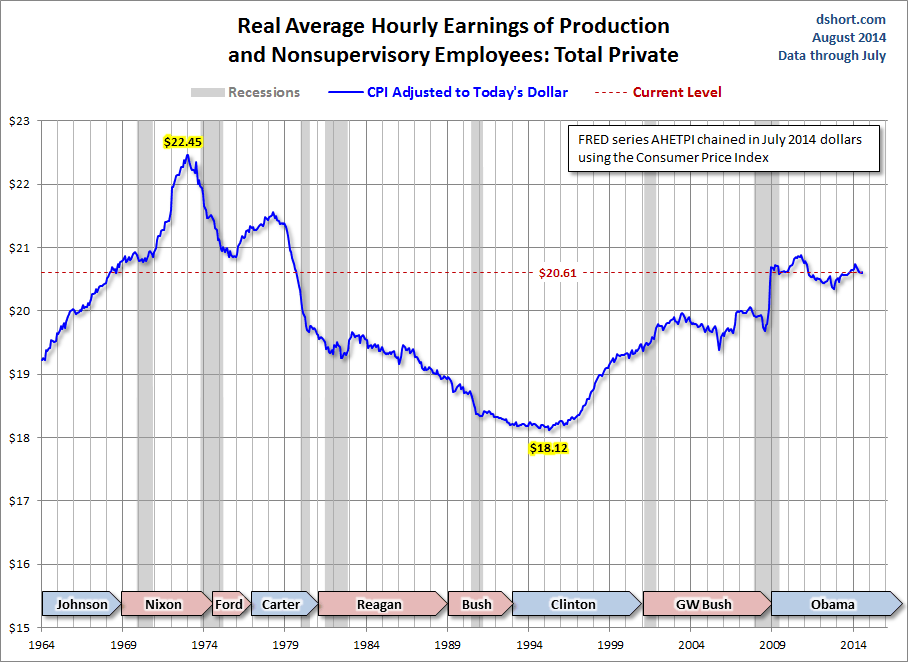
Earlier this week I updated my commentary on Five Decades of Middle Class Wages, an analysis of Real Average Hourly Earnings of Production and Nonsupervisory Employees. During the 21st century and especially since the end of the Great Recession, wages have clearly been stagnant.
But, as Mark Twain famously remarked, "there are three kinds of lies: lies, damned lies, and statistics."
I was, therefore, not surprised when a reader sent me a link to a blog article entitled "Real Wage Stagnation Is a Bit of a Myth." Seriously! The article featured a chart that included the very same earnings data series that I had used, but it came to quite the opposite conclusion:
"Contrary to popular belief, wages have been rising a bit faster than prices. In other words, real wages haven’t stagnated as widely believed, but have been moving higher, albeit at a slow pace." |
All it takes is a simple statistical manipulation to paint a smiley face on the real wage data. And what is that? Choose a tame deflator for your inflation adjustment.
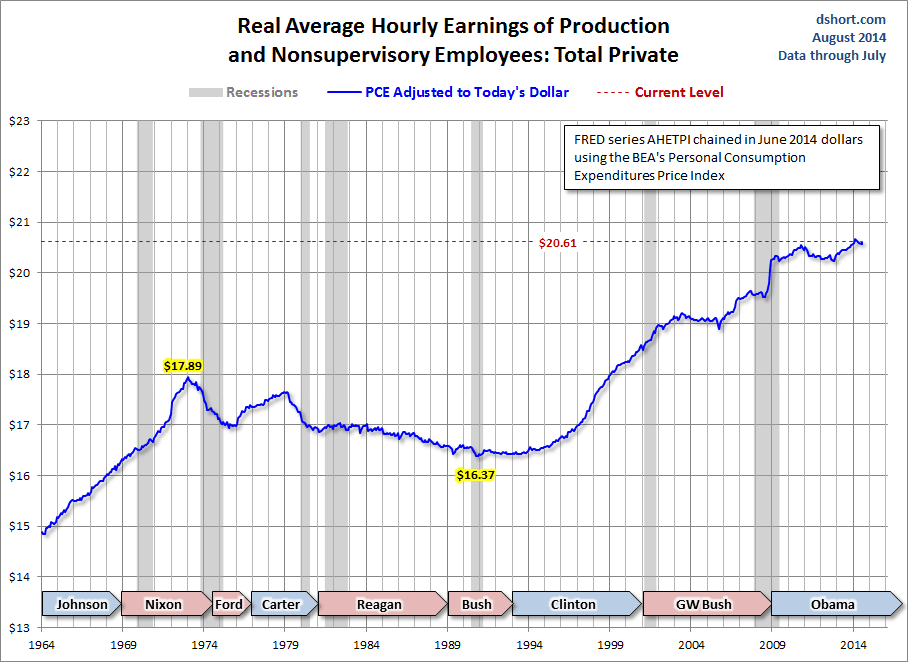
Here are side-by-side charts of the Average Hourly Earnings of Production and Nonsupervisory Employees stretching back to 1964, the year the Bureau of Labor Statistics (BLS) initiated the series. The chart on the left is my analysis. The one on the right is the optimistic variant that claims stagnation is a "myth" (click them for larger versions).
In the left chart above, I adjusted for inflation using the Consumer Price Index for Urban Consumers, the deflator we commonly refer to as the CPI. This index is produced by the BLS, the same agency responsible for the monthly Establishment Survey from which the wage data is derived. The CPI is by far the most widely used index for gauging inflation. Its first cousin, the CPI-W, has been used by the government for Social Security Cost of Living Adjustments since the origin of COLAs in 1975. Another close cousin, the CPI-U-RS (an annual index) is used by the Census Bureau to calculate Real Household Incomes.
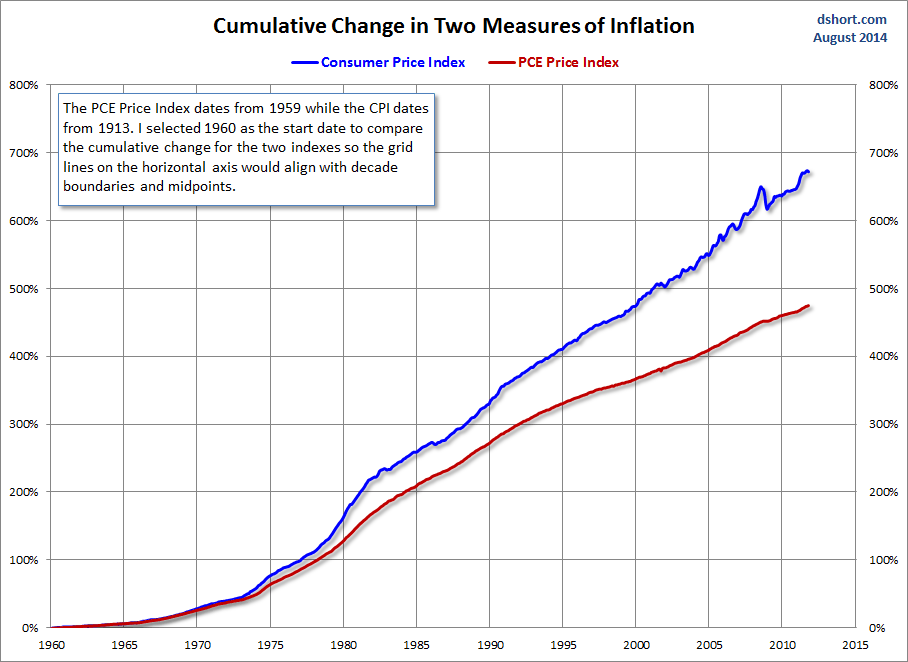
In contrast, the "stagnation is a myth" article used the Bureau of Economic Analysis's Personal Consumption Expenditures Price Index for inflation adjustment. That's the deflator I used in the right chart above. The BEA is an agency of the Department of Commerce. Their PCE deflator and their somewhat similar GDP deflator consistently show lower inflation than the Depart of Labor's BLS. How different? Here is an overlay illustrating the cumulative change in CPI and the PCE Price Index since 1960.
I'm confident that the Labor and Commerce departments produce their respective inflation data with honest intentions. However, I would point out that the most closely watched metric of the overall economy, Real GDP, is inversely correlated with inflation: The lower the inflation index, the higher our Real GDP and (presumably) the happier our business environment, which is the main purview of the Department of Commerce. And as I pointed out above, the Census Bureau, which is also within the Commerce Department and a sister agency to the BEA, uses the CPI-U-RS to calculate Real Household Income rather than the BEA's PCE Price Index.
Wages During the Recovery: Distinguishing Myth from Reality
Here is an overlay comparison of the growth of Real Average Hourly Earnings of Production and Nonsupervisory Employees since June 2009, the month when the business cycle expansion officially began. One uses the BEA's PCE Price Index, the other uses the BLS's Consumer Price Index.
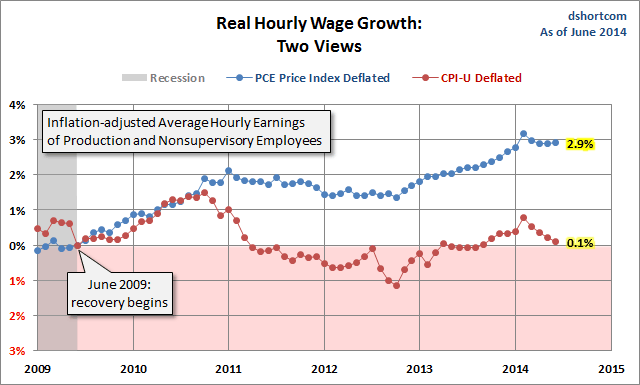
As we can clearly see, real wage growth with (in my view) the "correct" deflator is stagnant. In fact, if we use its cousin, the Consumer Price Index for Urban Wage Earners and Clerical Workers (CPI-W), the stagnation is actually worse.
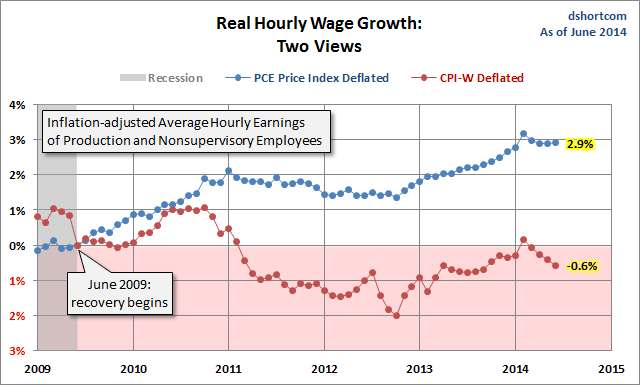
As I mentioned earlier, the CPI-W is the inflation gauge used by the government for Social Security COLA adjustments, which perhaps enhances its credibility as the preferred deflator for wages. Note also the BLS's specific designation for this deflator: "for Urban Wage Earners and Clerical Workers".
Does Janet Yellen Think Wage Stagnation is a Myth?
On Friday Federal Reserve Chair Janet Yellen was the headline speaker at this year's Jackson Hole summit for central bankers. Does she endorse the optimistic claim that real wage stagnation is a bit of a myth? Apparently not. Her summit speech included the following assertions [bolding added by me]:
Over the past several years, wage inflation, as measured by several different indexes, has averaged about 2 percent, and there has been little evidence of any broad-based acceleration in either wages or compensation. Indeed, in real terms, wages have been about flat, growing less than labor productivity. |
In closing, I will state something that I hope is obvious to my readers: My personal goal is to analyze economic data in an ongoing search for reality ... aka "the truth". But sometimes the truth can be obscured by "Lies, damn lies, and statistics."
Footnote: The data for Average Hourly Earnings of Production and Nonsupervisory Employees: Total Private (AHETPI) is one of the most popular series in FRED repository. The notes on the FRED website document the job types included in the series. This cohort of wage earners is clearly the backbone of American employment.
Production and related employees include working supervisors and all nonsupervisory employees (including group leaders and trainees) engaged in fabricating, processing, assembling, inspecting, receiving, storing, handling, packing, warehousing, shipping, trucking, hauling, maintenance, repair, janitorial, guard services, product development, auxiliary production for plant's own use (for example, power plant), recordkeeping, and other services closely associated with the above production operations.
Nonsupervisory employees include those individuals in private, service-providing industries who are not above the working-supervisor level. This group includes individuals such as office and clerical workers, repairers, salespersons, operators, drivers, physicians, lawyers, accountants, nurses, social workers, research aides, teachers, drafters, photographers, beauticians, musicians, restaurant workers, custodial workers, attendants, line installers and repairers, laborers, janitors, guards, and other employees at similar occupational levels whose services are closely associated with those of the employees listed.

