
The equity markets are at an interesting crossroads right now. Many of the short-term charts I watch are giving some hints of an oversold market while longer-dated price action is showing some breaking down in equities that could take us lower. However, we still must contend with end-of-the-year window dressing and the fiscal cliff nonsense.
With the weakness in stocks over the past few weeks we’ve seen the VIX start to tick higher. Today I want to look at an interesting way to find mean-reversion opportunities in the Volatility index. The current level in the VIX is still under 20, so we aren’t quite to a price extreme, but it has still enjoyed a nice run and may be due for some kind of pull back.
The chart we are going to look at has the Volatility index in the top panel with the Rate of Change (ROC) indicator in the bottom panel. The absolute level of the ROC indicator doesn’t tell us much. For that reason I’ve overlapped the Bollinger Bands on top of the ROC. This helps us get a sense of when Rate of Change might be ‘out of bounds’ in relation to the two bands.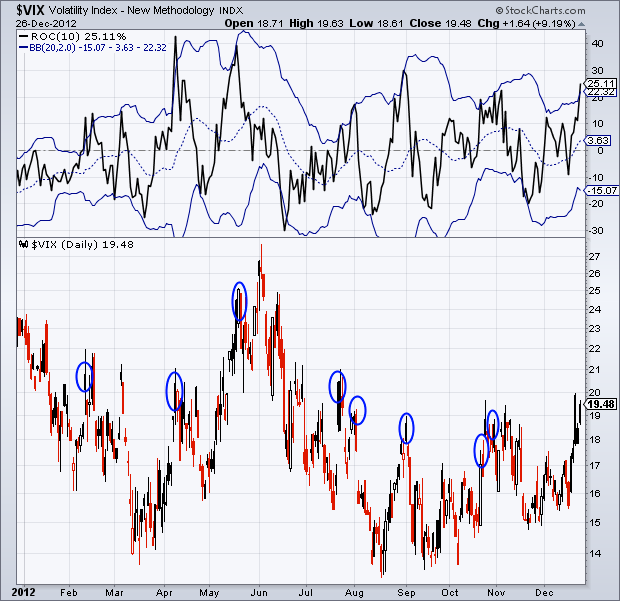
As you can see, when the black ROC indicator breaks above the top Bollinger Band we often see a period of weakness in the VIX. Now that's not always the case, as not every indicator works all the time. But it is a great example of how we can use two different indicators -- the Rate of Change and Bollinger Bands -- to get a better idea of what a security or index is doing.
Disclaimer: Do not construe anything written in this post or this blog in its entirety as a recommendation, research, or an offer to buy or sell any securities. Everything in this post is meant for educational and entertainment purposes only. I or my affiliates may hold positions in securities mentioned in the blog. Please see my Disclosure page for full disclaimer.
- English (UK)
- English (India)
- English (Canada)
- English (Australia)
- English (South Africa)
- English (Philippines)
- English (Nigeria)
- Deutsch
- Español (España)
- Español (México)
- Français
- Italiano
- Nederlands
- Português (Portugal)
- Polski
- Português (Brasil)
- Русский
- Türkçe
- العربية
- Ελληνικά
- Svenska
- Suomi
- עברית
- 日本語
- 한국어
- 简体中文
- 繁體中文
- Bahasa Indonesia
- Bahasa Melayu
- ไทย
- Tiếng Việt
- हिंदी
Mean Reversion And The Volatility Index
Published 12/27/2012, 07:32 AM
Updated 07/09/2023, 06:31 AM
Mean Reversion And The Volatility Index
Latest comments
Loading next article…
Install Our App
Risk Disclosure: Trading in financial instruments and/or cryptocurrencies involves high risks including the risk of losing some, or all, of your investment amount, and may not be suitable for all investors. Prices of cryptocurrencies are extremely volatile and may be affected by external factors such as financial, regulatory or political events. Trading on margin increases the financial risks.
Before deciding to trade in financial instrument or cryptocurrencies you should be fully informed of the risks and costs associated with trading the financial markets, carefully consider your investment objectives, level of experience, and risk appetite, and seek professional advice where needed.
Fusion Media would like to remind you that the data contained in this website is not necessarily real-time nor accurate. The data and prices on the website are not necessarily provided by any market or exchange, but may be provided by market makers, and so prices may not be accurate and may differ from the actual price at any given market, meaning prices are indicative and not appropriate for trading purposes. Fusion Media and any provider of the data contained in this website will not accept liability for any loss or damage as a result of your trading, or your reliance on the information contained within this website.
It is prohibited to use, store, reproduce, display, modify, transmit or distribute the data contained in this website without the explicit prior written permission of Fusion Media and/or the data provider. All intellectual property rights are reserved by the providers and/or the exchange providing the data contained in this website.
Fusion Media may be compensated by the advertisers that appear on the website, based on your interaction with the advertisements or advertisers.
© 2007-2024 - Fusion Media Limited. All Rights Reserved.