CLUES BACK IN FEBRUARY
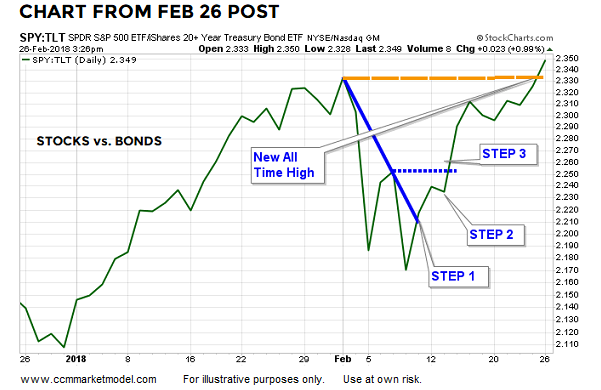
A February 26 post outlined the longer-term risk-on implications of trend flips in the stock (NYSE:SPY) vs. bond (NASDAQ:TLT) ratio and the tech (NYSE:VGT) vs. bond (NASDAQ:TLT) ratio. Rather than having growth-oriented stocks making a new high relative to defensive-oriented bonds, we would expect bonds to be leading in a "fear of a recession and bear market" scenario as shown on February 5. The chart below favors bullish probabilities.

S&P 500 TRYING TO REGAIN BULLISH FORM
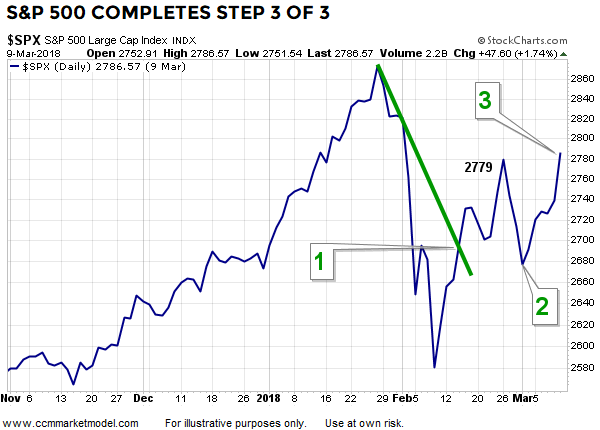
When a market corrects and enters a short-term downtrend, three things need to happen for the primary bullish trend to regain control. Step 1 is breaking above a downward-sloping trendline (see chart below). Step 2 is making a higher low above the previous lowest low. Step 3 is making a higher high. The S&P 500 closed above 2,779 on March 9.

A close back below 2,779 does not negate the short-term bullish and probability-related progress; for that to occur the S&P 500 would have to make a lower low below the Step 2 point (2,677) in the chart above, which is entirely possible.
The further the S&P 500 moves above 2,779 in the days and weeks ahead, the more meaningful it would become from a bullish perspective. Conversely, the further the S&P 500 moves below 2,677, the more meaningful it would become from a bearish perspective. Nothing is binary in the financial markets.
TECH STOCKS REGAIN 100% OF CORRECTION DRAWDOWN
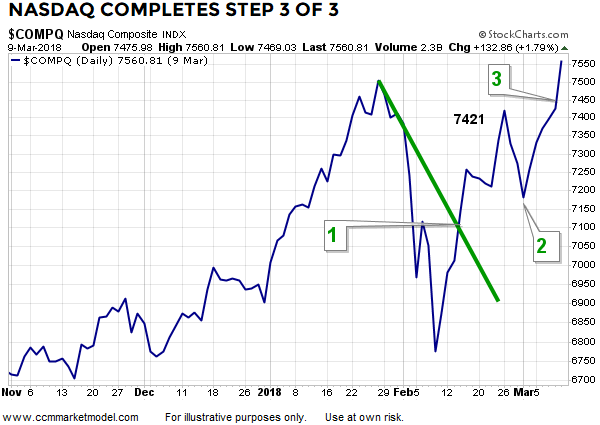
Tech stocks were a leading market sector before the 2018 correction, as noted back in June of last year. Typically, it is a good sign for the broader market when economically-sensitive leaders resume their leadership, which is exactly what has happened in recent weeks. The NASDAQ Composite printed a new all-time high on Friday, March 9, 2017.

DO THE CHARTS SUPPORT THE BEARISH HYPE?
This week's video objectively compares 2018 to a bullish period and a bearish period. The video also follows the S&P 500's primary trend step-by-step between January 8 and March 8, allowing us to see the incremental impact of the recent spike in bond yields, tariffs, and Gary Cohn's resignation.
INDUSTRIALS HAVE SOME WORK TO DO
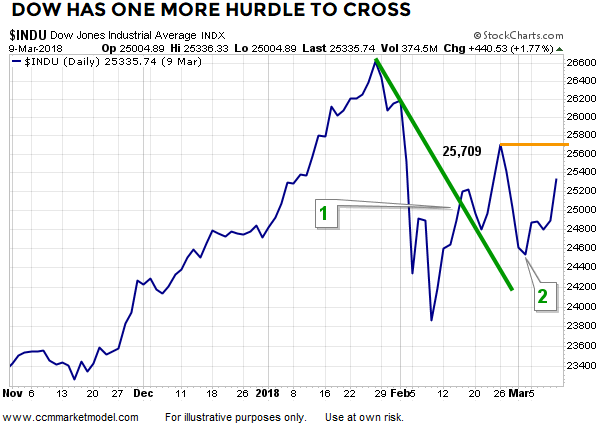
Is it alarming that the Dow has not made a "step 3" higher high yet? No, there is no market law that says all three major indexes must do everything in unison. If we are 3 or 4 months down the road and the Dow is still treading water, then it would be more concerning. To make a step 3 higher higher high, the Dow needs to close above 25,709.

THE PRIMARY TREND REMAINS BULLISH
The charts above provide some odds-related insight into a resumption of the market's bullish primary trend. Since we know it is not unusual for markets to bounce around in a volatile and confused manner after a waterfall decline, it remains prudent to take it day by day focusing on the health of the primary trend. If the primary trend starts to wane, we will adjust as needed.
