
I was gone last week at the TD Ameritrade National Conference in San Diego but looks like it turned out to be an interesting week for the financial markets. While Volatility (VIX) has expanded, I’m not seeing the same signs I normally do at past buy able dips. For instance the number of stocks at new 52-week lows on the NYSE at the last S&P 500 October low was 617 and at the December low it hit 434, but this most recent dip has only seen 150 NYSE stocks hit annual lows.
January closed down by a little over 3%, making it the second consecutive monthly close lower since May 2012. Meanwhile, the U.S. 10-Year treasury Yield appears to be quickly approaching the 2012 low as January’s move nearly finishes erasing the rise in yield during 2013.
Trend
The trend of the S&P 500 (SPX) is currently in a short-term period of consolidation while still maintaining its long-term up trend. Equities have retreated back to October 2014 levels while putting in a series of short-term lows near 2000 and a double top at 2060.

Breadth
A few weeks ago we had, what turned into, a false break in the Common Stock Only NYSE Advance-Decline Line. Since then, stocks have been trying to find support near 2000 in the S&P 500 while the A-D Line has been able to create a slight series of higher lows over the last month. While the Percentage of Stocks Above Their 200-Day Moving Average is in a defined down turn, it too has put in a set of higher lows in January. Is this hinting at the direction that equities will head in the coming weeks? We’ll see.

A Negative January
While many traders will likely look to January as an indicator for how the full year will turn out, I’ve already discussed the method that I prefer two weeks ago. Nautilus Research tweeted out the following chart which I found interesting. It shows previous periods where January has been negative following three positive years. Below the chart shows the seven prior occurrences only one follow year was able to squeak out a gain, which was still less than 1% at that.

Momentum
Coming into 2015 we had a bearish divergence in momentum which was followed by a false breakout in the S&P 500 with stocks struggling ever since. However, like Breadth the Relative Strength Index has created a slight positive bias while the S&P 500 continues to test 2000.

Financial Stress
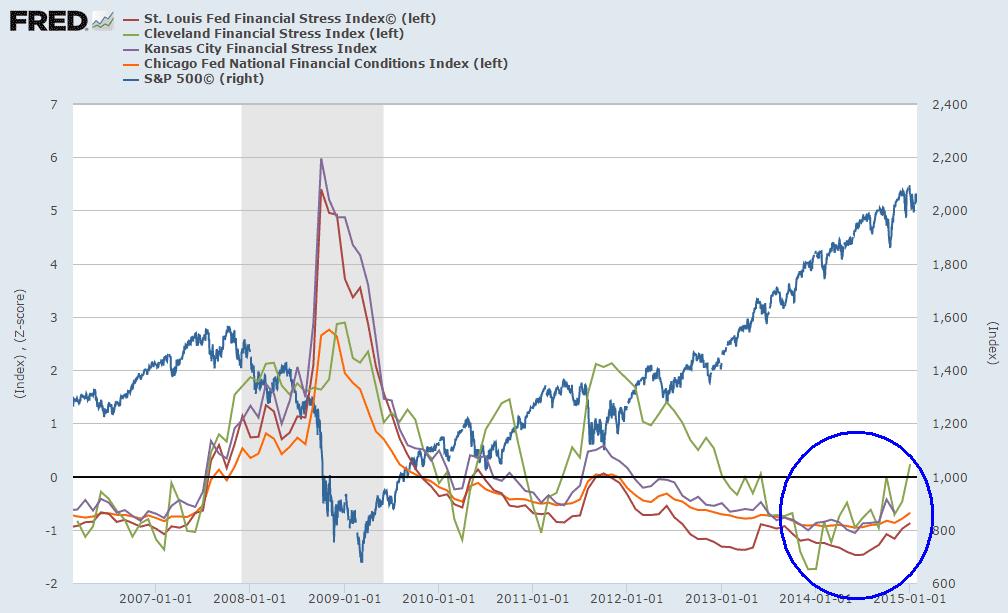
Cris Sheridan at Financial Sense recently wrote an article showing the current bear case for equities. One of the charts that Cris shows is a compilation of the Federal Reserve Financial Stress Indices. You’ll see in the chart below that the indices have begun to rise after falling for the last several years. Three of the four Stress Indices are still below zero, while all four broke above the zero-line at the prior major market high in 2007. I’ll be keeping an eye on these sets of data and will be watching if they all continue to advance in the coming months.
China
Like the U.S. equities did at the start of the year, Chinese stocks have created a potential false breakout on the weekly chart of the iShares China ETF (ARCA:FXI). This occurs after the Relative Strength Index (RSI) failed to confirm the breakout and put in a lower high, creating a bearish divergence. Volume also did not confirm the breakout with fewer shares being trading on positive days over down days as measured by the On Balance Volume indicator. Prior dips in FXI have found support at the 50-week Moving Average. Will FXI also end up declining back to its 50-week MA?

Last Week’s Sector Performance
Last week we saw the Materials (ARCA:XLB) sector as the best relative performer followed by Consumer Discretionary (ARCA:XLY) and Energy (ARCA:XLE). Technology (NYSE:XLK) and Consumer Staples (ARCA:XLP) were the worst relative performers for the week.

Year-to-Date Sector Performance
While the S&P 500 finished in the red for January, Utilities (NYSE:XLU) and Health Care (ARCA:XLV) were able to pull out a gain for the month. While they had a rough last week of the month, Consumer Staples were still able to outpace the major index. Financials Financial Select Sector (ARCA:XLF) and Energy are the worst performers YTD.

Disclaimer: Do not construe anything written in this post or this blog in its entirety as a recommendation, research, or an offer to buy or sell any securities. Everything in this post is meant for educational and entertainment purposes only. I or my affiliates may hold positions in securities mentioned in the blog. Please see my Disclosure page for full disclaimer.