Get 40% Off
🚨 Volatile Markets? Find Hidden Gems for Serious Outperformance
Find Stocks Now

Market Scorecard: Bears 2 Bulls 1

Published 04/10/2014, 12:06 AM
Updated 07/09/2023, 06:31 AM

It's been two days that the US equity market has rallied after the bloodbath in the momentum stocks. So where are we now?

Market facing technical resistance

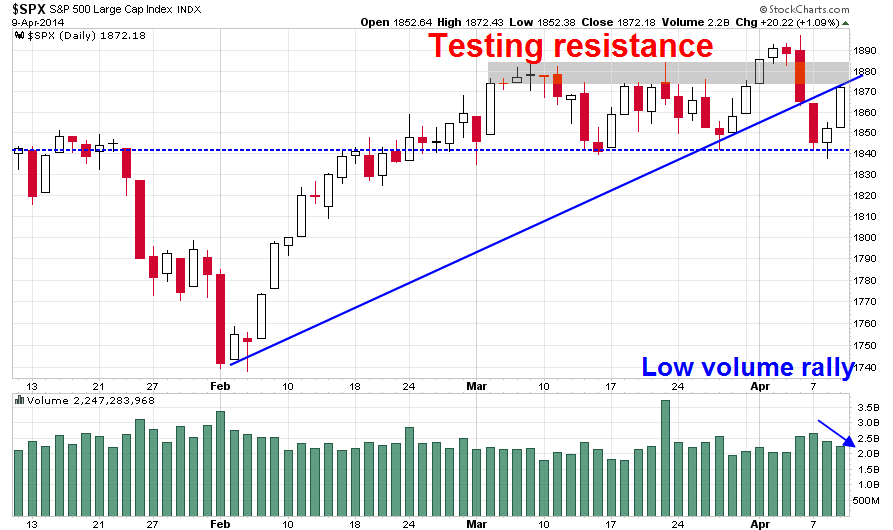
Here is my take on the current technical position of the market. As the chart below shows, the SPX bounced off support at 1840 and rallied for two days. However, the rally was on declining volume, which is never a good sign, and the index is approaching a couple of technical resistance levels. One is shown by an uptrend that stretches back to early February; and the other is a well defined resistance zone at the 1874-1884 level.

SPX Daily
If you are scoring this at home, chalk one up for the bears.

Risk appetite is rolling over

 
The recent carnage in the high flying Biotech and Social Media stocks are well-known, but the technical effects of the damage are likely to be long lasting. The chart below shows a composite index that I built based on an equally-weighted long position in the Nasdaq 100 and Russel 2000 (high beta risk-on index) minus an equally weighted short position in the defensive sectors of Consumer Staples, Telecom and Utilities (low beta risk-off index), where the composite Risk Appetite Index is set at 100 on December 31, 2011.
Risk Appetite Index
As the chart shows, the Risk Appetite Index has violated an uptrend and has started to roll over. This picture of fading risk appetite forms a negative divergence when compared to the SPX, which remains in an uptrend.
3rd party Ad. Not an offer or recommendation by Investing.com. See disclosure here or remove ads .

Score another for the bears.

CapEx Index still constructive

I wrote on Sunday that in order for the bull market to continue, we need to see an acceleration in capital expenditures at this part of the cycle and the acid test will come this Earnings Season (see What equity bulls need for the next phase). While it is still very early, the initial report by Alcoa (NYSE:AA) was well received by the market.

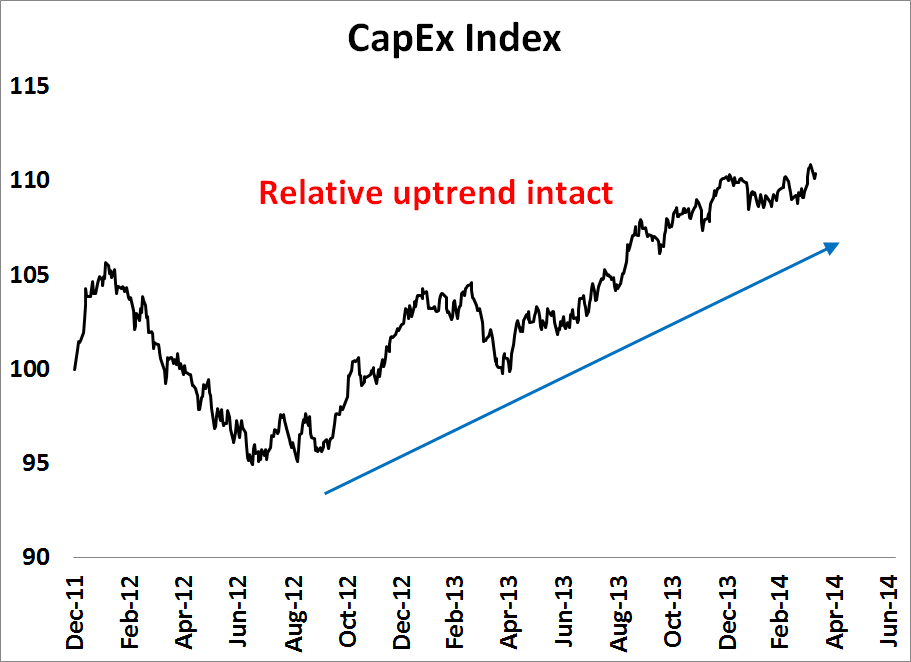
My CapEx Index, which is composed of an equal weighted relative return index of the Industrial sector (Industrial Sector SPDR Trust (ARCA:XLI)) and the (Morgan Stanley Cyclical Index) against SPX, remains in an uptrend, which is a constructive signal for the stock market. For now, Mr. Market is giving the cyclical recovery story the benefit of the doubt.

CapEx Index
Score one for the bulls.

Game not over

 
So far, the score is Bears 2 and Bulls 1. The bears have the upper hand, but the game is by no means over. In order for the correction to continue, we need to see a combination of further technical deterioration, such as a decisive violation of the 1840 level, a downturn in the CapEx Index or some exogenous event, such as further tensions in eastern Ukraine or heightened fears of a China crash.

The bulls, on the other hand, need to sidestep these risks and convince the market that a cyclical acceleration of growth is indeed at hand. Their cause could be helped by further dovish pronouncements from the Federal Reserve or news of a decisive stimulus program out of Beijing.

Disclsosure: Cam Hui is a portfolio manager at Qwest Investment Fund Management Ltd. (“Qwest”). The opinions and any recommendations expressed in the blog are those of the author and do not reflect the opinions and recommendations of Qwest. Qwest reviews Mr. Hui’s blog to ensure it is connected with Mr. Hui’s obligation to deal fairly, honestly and in good faith with the blog’s readers.”

None of the information or opinions expressed in this blog constitutes a solicitation for the purchase or sale of any security or other instrument. Nothing in this blog constitutes investment advice and any recommendations that may be contained herein have not been based upon a consideration of the investment objectives, financial situation or particular needs of any specific recipient. Any purchase or sale activity in any securities or other instrument should be based upon your own analysis and conclusions. Past performance is not indicative of future results. Either Qwest or I may hold or control long or short positions in the securities or instruments mentioned.

3rd party Ad. Not an offer or recommendation by Investing.com. See disclosure here or remove ads .

Latest comments

Risk Disclosure: Trading in financial instruments and/or cryptocurrencies involves high risks including the risk of losing some, or all, of your investment amount, and may not be suitable for all investors. Prices of cryptocurrencies are extremely volatile and may be affected by external factors such as financial, regulatory or political events. Trading on margin increases the financial risks.
Before deciding to trade in financial instrument or cryptocurrencies you should be fully informed of the risks and costs associated with trading the financial markets, carefully consider your investment objectives, level of experience, and risk appetite, and seek professional advice where needed.
Fusion Media would like to remind you that the data contained in this website is not necessarily real-time nor accurate. The data and prices on the website are not necessarily provided by any market or exchange, but may be provided by market makers, and so prices may not be accurate and may differ from the actual price at any given market, meaning prices are indicative and not appropriate for trading purposes. Fusion Media and any provider of the data contained in this website will not accept liability for any loss or damage as a result of your trading, or your reliance on the information contained within this website.
It is prohibited to use, store, reproduce, display, modify, transmit or distribute the data contained in this website without the explicit prior written permission of Fusion Media and/or the data provider. All intellectual property rights are reserved by the providers and/or the exchange providing the data contained in this website.
Fusion Media may be compensated by the advertisers that appear on the website, based on your interaction with the advertisements or advertisers.
© 2007-2024 - Fusion Media Limited. All Rights Reserved.