Get 40% Off
These stocks are up over 10% post earnings. Did you spot the buying opportunity? Our AI did.Read how

Market Risk Cleared While Core Market Health Indicators Are Below Zero

Published 10/11/2015, 02:00 AM
Updated 07/09/2023, 06:31 AM

As I mentioned on Tuesday, my market risk indicator cleared during the week and the positive readings have held throughout the week. However, my core market health indicators are all still below zero.
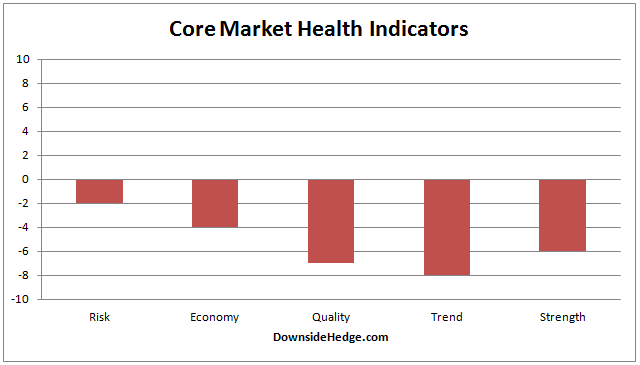
core market health indicators

This changes the portfolio allocations as follows.

Long / Cash portfolio: 100% cash

Long / Short Hedged portfolio: 50% long stocks I believe will outperform in and uptrend and 50% short the S&P 500 Index

Volatility Hedged portfolio: 100% long

As was the case in mid August the core indicators don’t like the current market internals, but the perception of risk is low. You’ll need to assess your own needs and risk tolerance to decide how much of a hedge (if any) you leave on your portfolio. If you’d rather use an ETF for the long portion of your portfolio here are some ideas on how to find one. Look at the comments too as a reader found several ETFs that met the high beta criteria.

At the end of August I wrote a post explaining why mid term volatility is a good hedging instrument. This latest signal provided a good example. From the market risk warning till today’s clearing the longs in the “official tracking” portfolio are down about 2% while iPath S&P 500 VIX Mid Term Futures Exp 30 Jan 2019 (NYSE:VXZ) is up roughly 6.5% and iPath S&P 500 Dynamic VIX Exp 18 Aug 2021 (NYSE:XVZ) is up about 5%. The S&P 500 Index (SPX) is up almost 2%. So even though the market is higher than it was on the warning date, mid term volatility is still positive. The point to be remembered here is that volatility on risk events enters the market quickly, but leaves it slowly.

3rd party Ad. Not an offer or recommendation by Investing.com. See disclosure here or remove ads .

Here’s a chart with the allocation changes over the past year. Green indicates increasing longs. Red is an aggressive hedge. Yellow is either adding a hedge (yellow after green) or softening it (yellow after red).
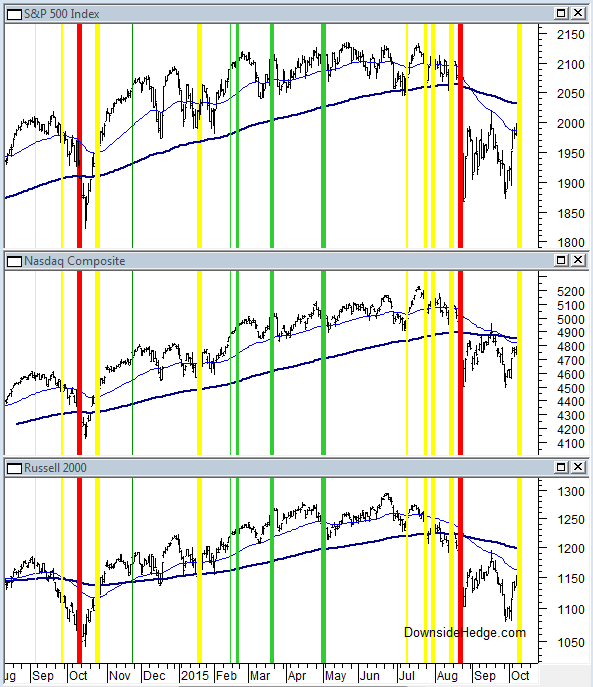
S&P 500 Index Chart

Latest comments

Risk Disclosure: Trading in financial instruments and/or cryptocurrencies involves high risks including the risk of losing some, or all, of your investment amount, and may not be suitable for all investors. Prices of cryptocurrencies are extremely volatile and may be affected by external factors such as financial, regulatory or political events. Trading on margin increases the financial risks.
Before deciding to trade in financial instrument or cryptocurrencies you should be fully informed of the risks and costs associated with trading the financial markets, carefully consider your investment objectives, level of experience, and risk appetite, and seek professional advice where needed.
Fusion Media would like to remind you that the data contained in this website is not necessarily real-time nor accurate. The data and prices on the website are not necessarily provided by any market or exchange, but may be provided by market makers, and so prices may not be accurate and may differ from the actual price at any given market, meaning prices are indicative and not appropriate for trading purposes. Fusion Media and any provider of the data contained in this website will not accept liability for any loss or damage as a result of your trading, or your reliance on the information contained within this website.
It is prohibited to use, store, reproduce, display, modify, transmit or distribute the data contained in this website without the explicit prior written permission of Fusion Media and/or the data provider. All intellectual property rights are reserved by the providers and/or the exchange providing the data contained in this website.
Fusion Media may be compensated by the advertisers that appear on the website, based on your interaction with the advertisements or advertisers.
© 2007-2024 - Fusion Media Limited. All Rights Reserved.