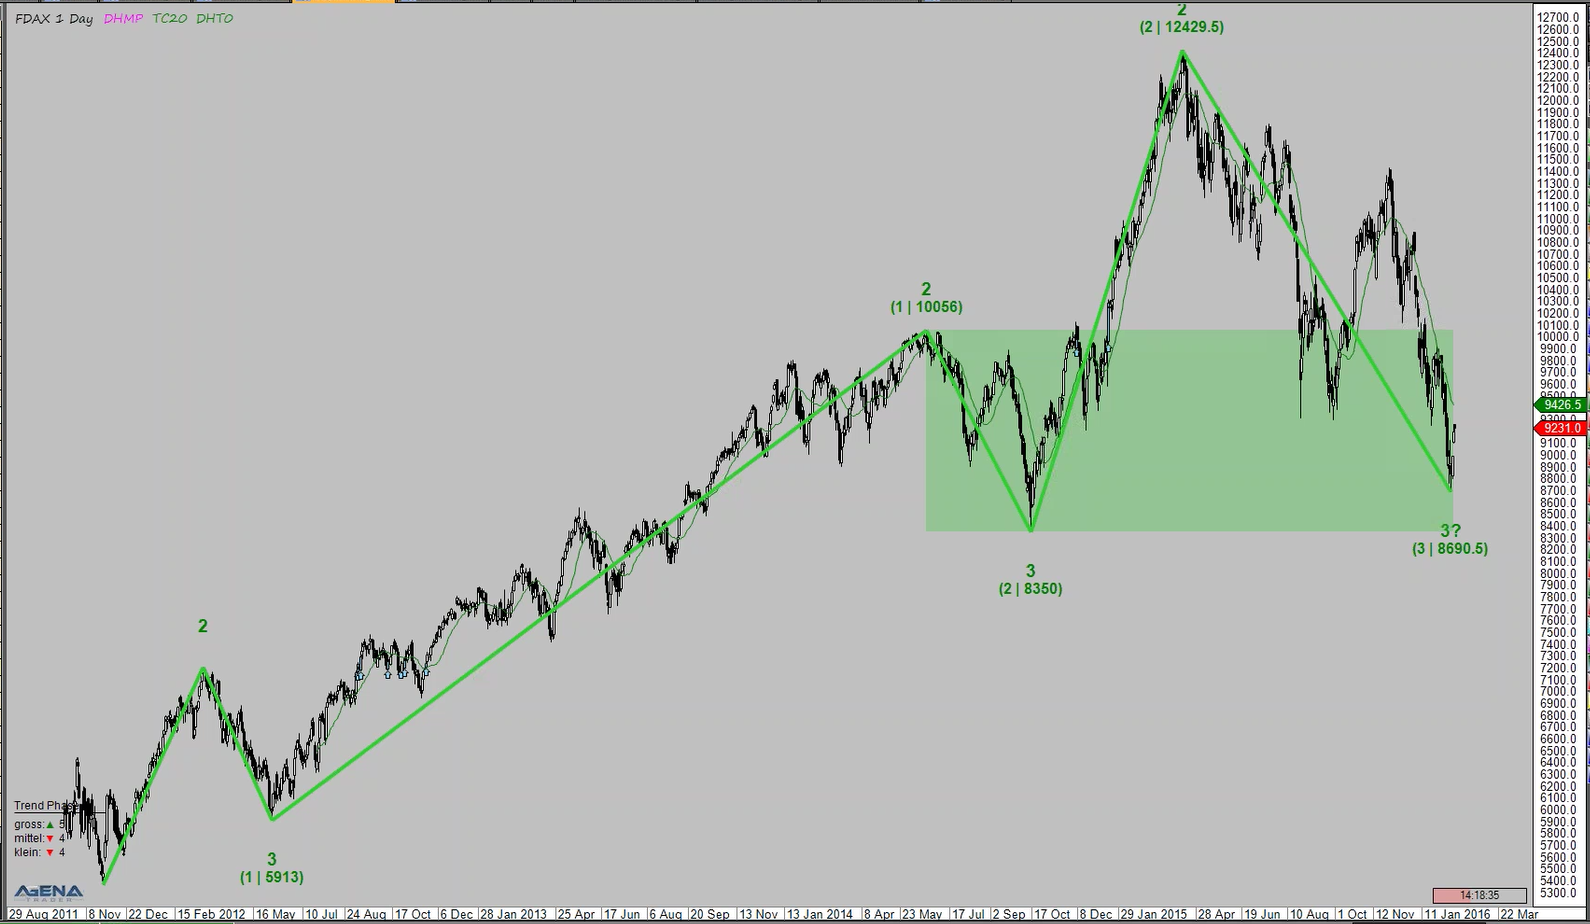
Let’s take a look at the German shares index (FDAX) first. Since yesterday was a holiday (which could also observed in the DAX), there was not so much movement. In the big picture we have various trend sizes, as well as in the daily chart where we are actually in a valid upwards trend:

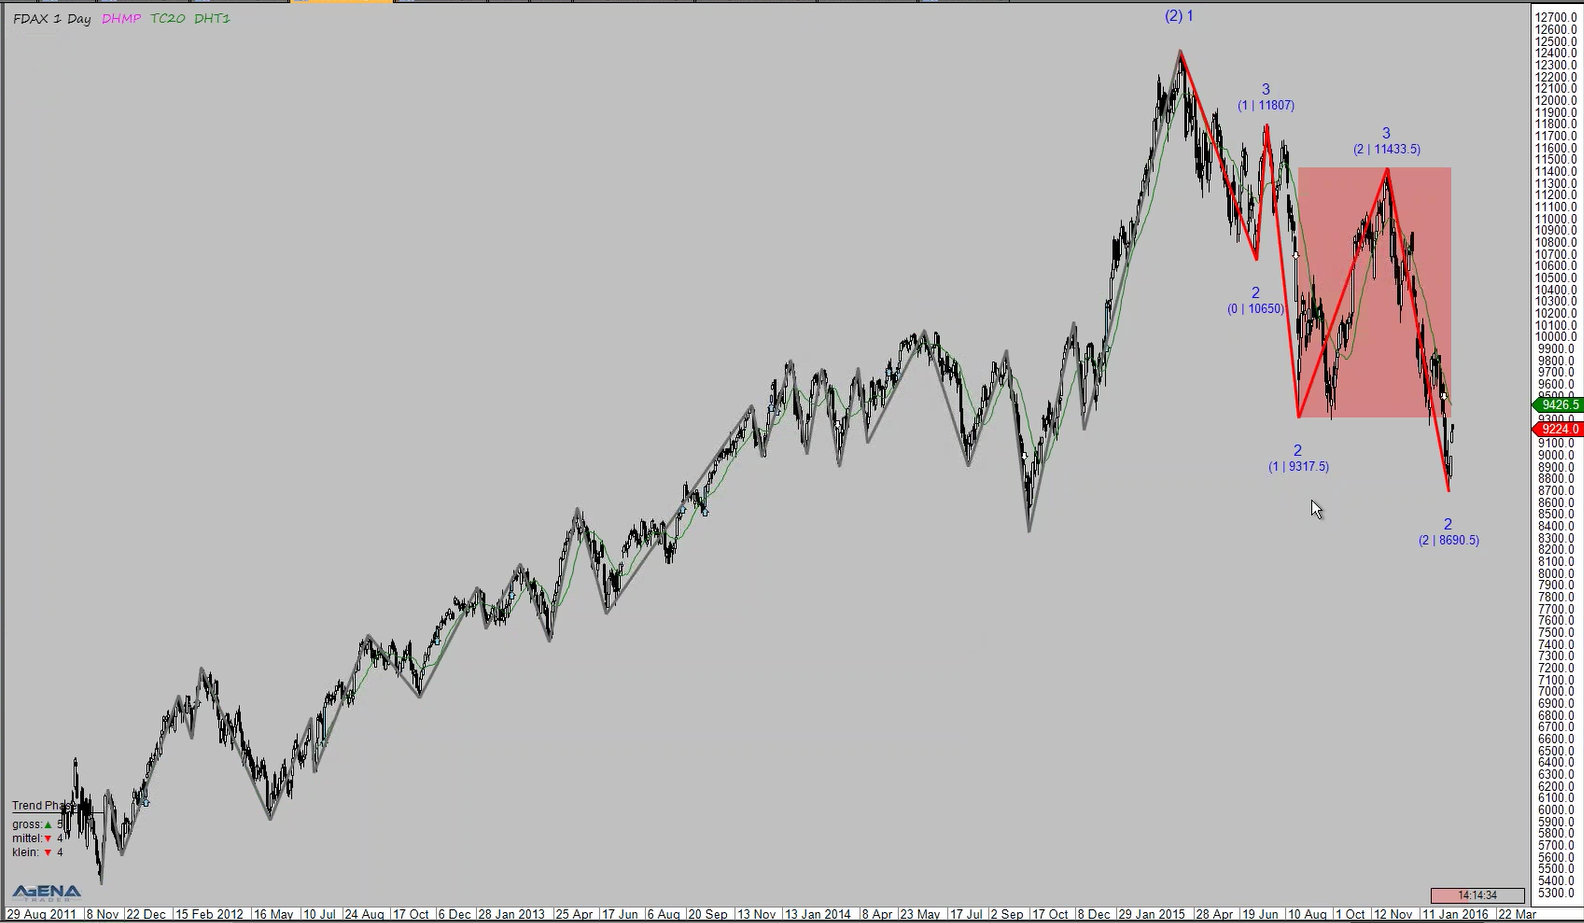
The market has turned back around and gone into its correction zone, but as long as it does not fall under the large low point at 8350 it’s simply a large correction. The small medium trend is pointing downwards in the daily chart, as is the small trend. Embedded in here is another inferior trend, running up to the beginning of the correction zone. Here we have the first potential for recovery; we will see how strong this correction is and whether it can form a bottom.

We have an upwards trend with this opening candle in the futures markets and a new correction zone 9245 and 9188. As long as the zone remains intact, the market can keep moving up. However, if the zone is the probability rises that the gap will be closed. It may not look like there is much buying pressure upwards, but the chances are there.
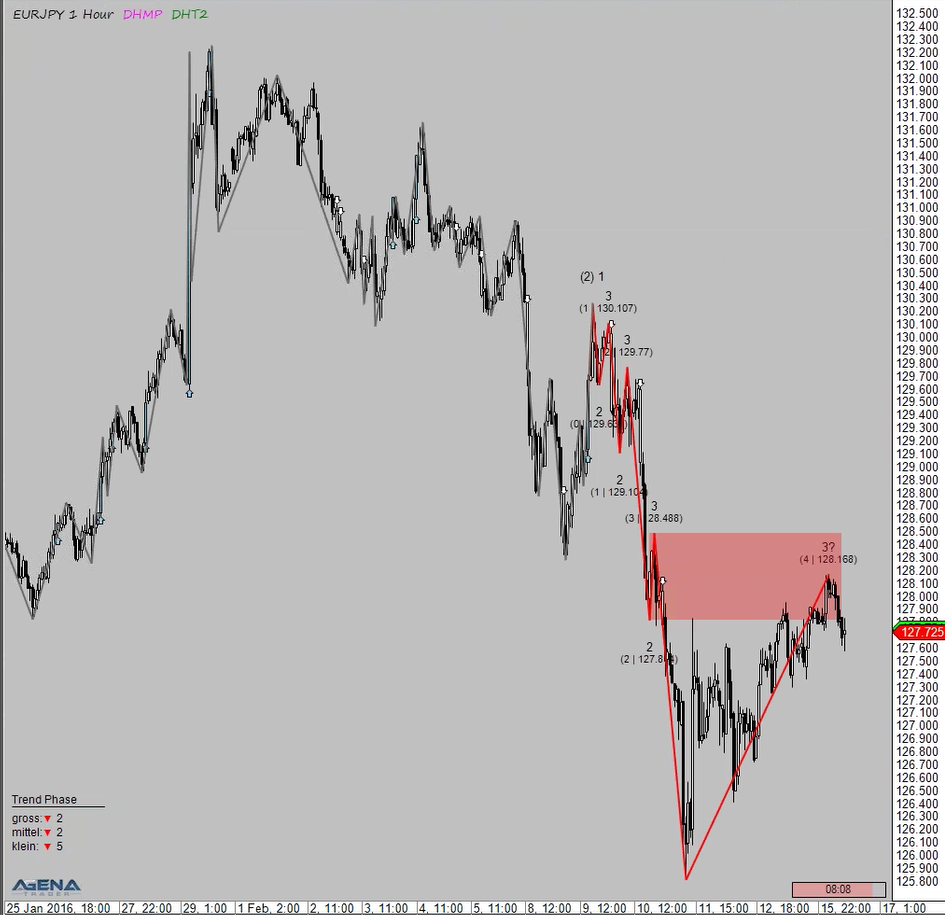
In the one hour chart of the EUR/JPY the trend corrected into correction zone with more then 50%. there is no signal in the superior trend. I would need a closing price below, and would be careful here.

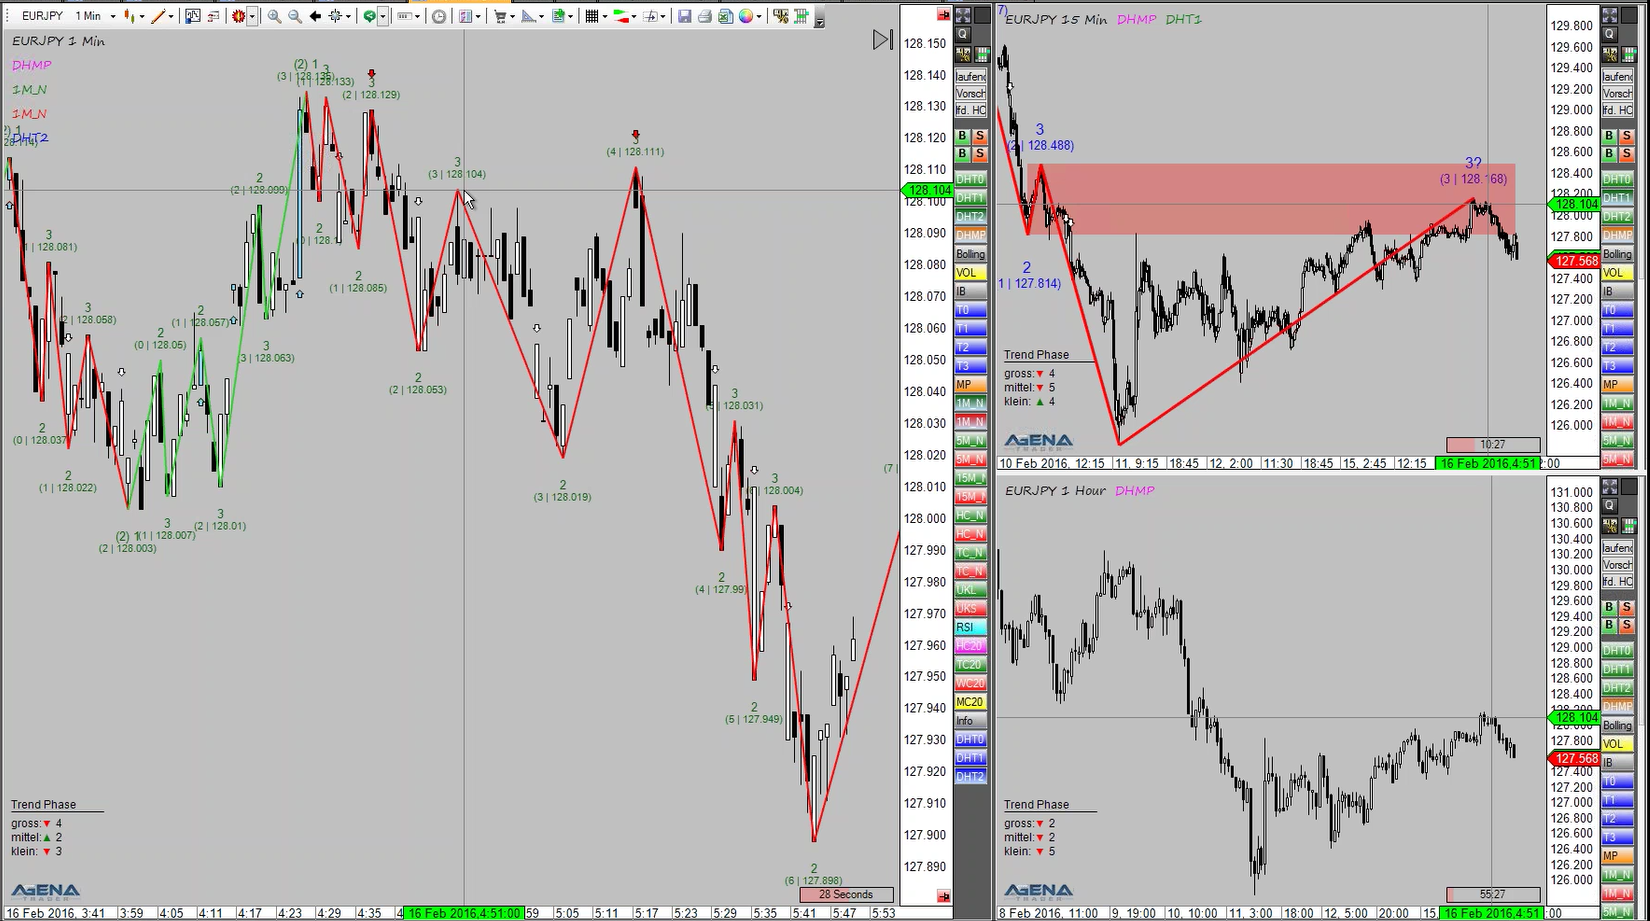
I want to come out of deeper corrections in all trends. For example, in the 1 Min chart you can see how deep out of the correction zone we are coming:

The end-of-day screening shows signals in Agilent Technologies (N:A). Here we have a nice young trend has gone nicely into the correction with some space, the superior trend is already in there, and the small trend in the day is also in a correction zone. It is a valid trend that we can work with.
In the 1 hour chart of the Sociedad Química y Minera (N:SQM), we definitely have a valid signal with space on lower side. There are also nice support points down below.
Waters Corporation (N:WAT) has a small trend which looks very nice, not too mature, has also corrected quite deeply, giving a bigger chance of getting to the profit zone faster. The superior trend has also corrected far. There is still space for this trend to carry on downwards.
There is a long signal in the Dupont Fabros Technology (N:DFT). It has a correction to the first point two, then broke off the first phase but it is a young trend and corrected back into the correction zone. There is a support point at 3834, the last big point two. This is a value where there are more positive points than negative points, and a definite possibility.
For presentation purposes the trading software "AgenaTrader" has been used.
IMPORTANT NOTE: Exchange transactions are associated with significant risks. Those who trade on the financial and commodity markets must familiarize themselves with these risks. Possible analyses, techniques and methods presented here are not an invitation to trade on the financial and commodity markets. They serve only for illustration, further education, and information purposes, and do not constitute investment advice or personal recommendations in any way. They are intended only to facilitate the customer's investment decision, and do not replace the advice of an investor or specific investment advice. The customer trades completely at his or her own risk. Please refer to the current version of the Terms and Conditions.
