T2108 Status: 55.3%
T2107 Status: 30.9%
VIX Status: 16.5
General (Short-term) Trading Call: slightly bearish
Active T2108 periods: Day #27 over 20%, Day #26 over 30%, Day #26 over 40%, Day #24 over 50% (overperiod), Day #1 under 60% (ending 8 days over 60%) (underperiod), Day #341 under 70%
Commentary
I made the case in the last T2108 Update for a bearish turn in the stock market. Monday, November 9, 2015, started a confirmation process for that change in outlook. T2108 closed out the day at 55.3% and is retesting the low point of what has become a month-long range. A breakdown serves as a bearish confirmation. If T2108 bounces again from here, I will back down a bit on my bearish trading call.
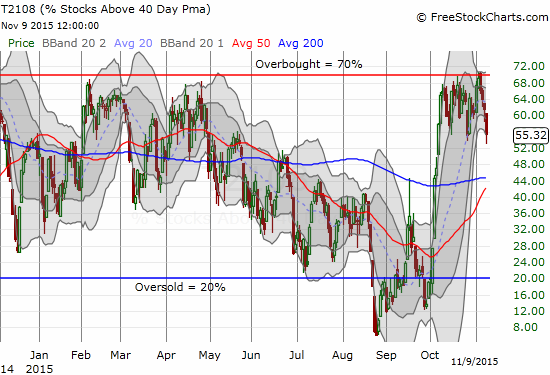
T2108 looks ready to break down.
The S&P 500 (N:SPY) is also facing its own important retest of support. The index fell almost 1%, got back in sync with T2108, dropped out of the primary uptrend channel, and came within a “hair” of retesting 200DMA support.
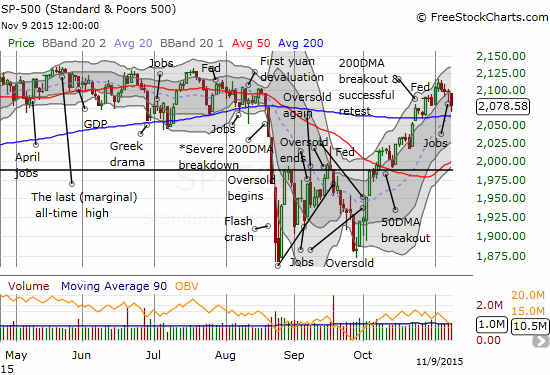
Momentum for the S&P 500 (SPY) is now waning as the index falls out of its primary uptrend channel for n important retest of support.
The volatility index, the VIX, added its own stamp of approval for more bearish tidings. It closed above the 15.35 pivot. This pivot has held for almost a month. The VIX closed cleanly above the pivot for the first time since October 21st.
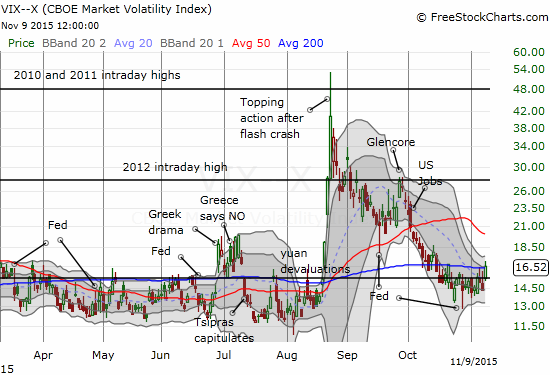
The volatility index pops above the pivot. Is it about to break out?
So momentum is waning from the stock market, and the waiting game continues for final confirmation – a 200DMA breakdown for the S&P 500.
In the last T2108 Update, I flipped bearish on the market but provided a lot of bullish charts. Time for some more bearish ones.
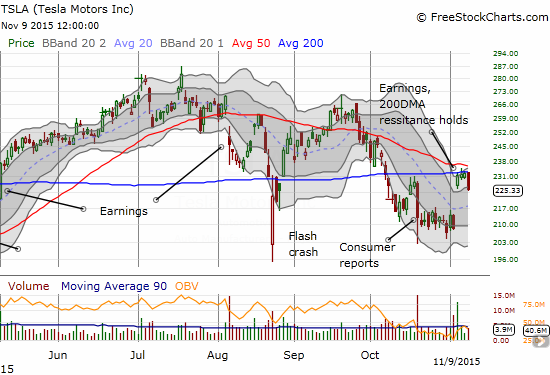
Tesla Motors Inc (O:TSLA) has not been able to follow-through on its post-earnings pop. Today’s 3% drop confirms the converged 50 and 200DMA as resistance.
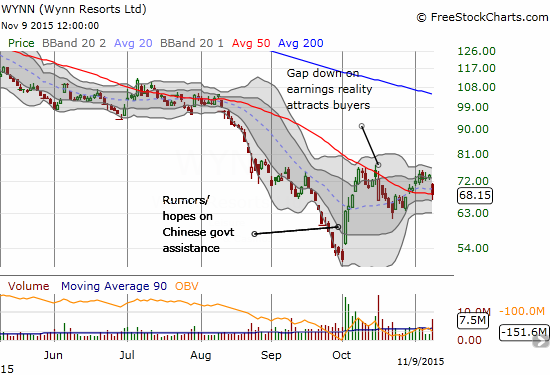
Wynn Resorts Limited (O:WYNN) gaps down on high volume and ends its attempt to bounce back from a poor response to earnings. The 50DMA barely holds as support.
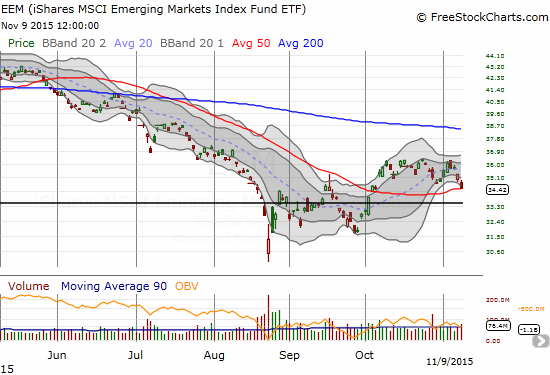
The iShares MSCI Emerging Markets (EEM) has resolved the churn from October downwards. The 50DMA is barely holding as support.
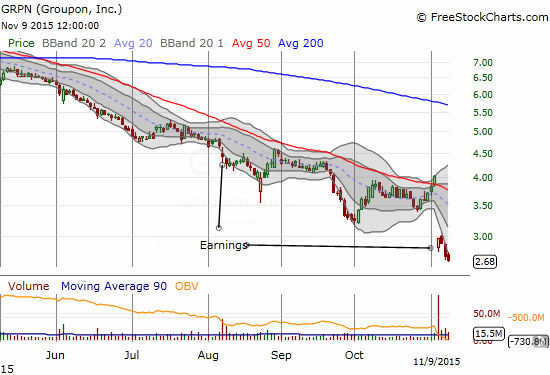
How much longer will Groupon Inc (O:GRPN) survive? A massive, high-volume post-earnings gap down confirms 50DMA resistance and a deepening downtrend.
And just because I have not posted a chart of the Shanghai Stock Exchange Composite Index (SSEC) in very long time, here is a reminder that trading conditions in China actually continue to improve ever so steadily. The last four days in particular have provided a very strong bounce off 50DMA support.
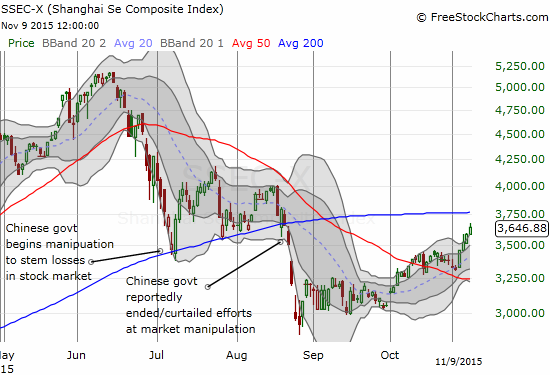
The Shanghai Stock Exchange Composite Index (SSEC) continues its recovery from the August Angst. A test of 200DMA resistance now looms.
Daily T2108 vs the S&P 500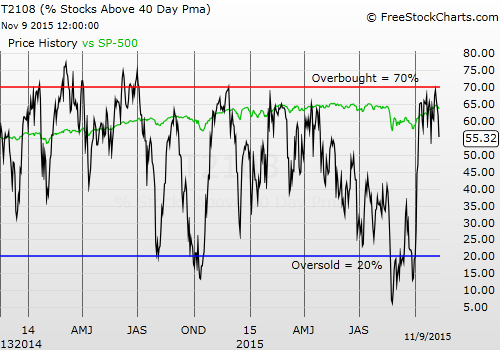
Black line: T2108 (measured on the right); Green line: S&P 500 (for comparative purposes)
Red line: T2108 Overbought (70%); Blue line: T2108 Oversold (20%)
Weekly T2108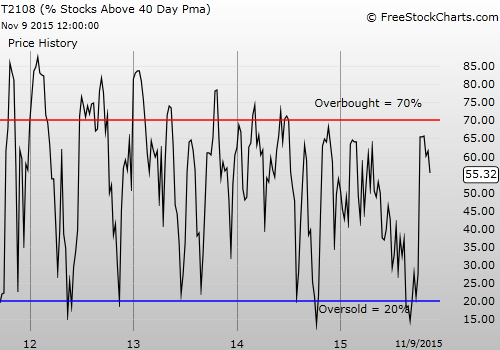
Be careful out there!
Full disclosure: net long the U.S. dollar
