One strategist I read regularly and who prepares weekly technical commentary, Charles Kirk at The Kirk Report, had a reference in this week's report relative to the strength of the current market. Kirk highlighted the below quote from James DePorre,
"If you simply focus on what the pricing action is saying, then your job of profitably navigating the market becomes a lot less complex. The simple fact is that we are in a very long-term uptrend, and trends tend to persist. The media might have all sorts of headlines to create their narrative, but all we really need to know is that the odds favor the bulls in an uptrend and vice versa. At some point, that pattern (and trend) will change, but trying to predict it ahead of time is a hard way to make a living."
The quote is certainly applicable in the equity market environment investors are currently experiencing as corrections and pullbacks seem to be nearly few and far between. I noted this lack of volatility in a post late last week, The Risk Of De-Risking The Equity Portfolio. And as it relates to trends, over the long term, the market trend is one that moves higher as can be seen in the below chart. An important observation from the below chart is the fact the line mapping the current market advance falls between long term support (green line) and resistance (red line.) So one might say the market is neither oversold or overbought from a technical perspective when only evaluating the below chart. 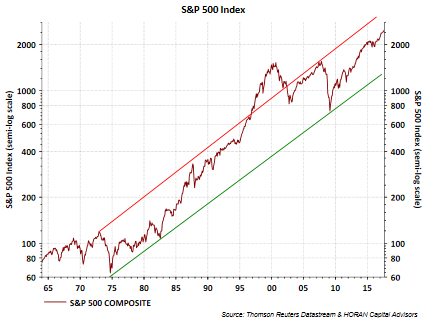
Evaluating the long term is relevant and appropriate, but as famed economist John Maynard Keynes once noted, "In the long run we are all dead." So evaluating the shorter term market picture is important too.
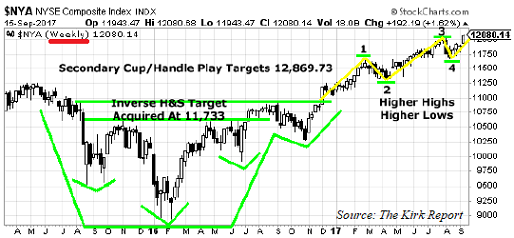
Charles Kirk included the below chart with the quote he shared from James DePorre. The weekly two and a half year chart represents the New York Stock Exchange Composite Index. The index closed Friday at 12,080 and the technical chart pattern indicates a target price of 12,869. This target price represents a 6.5% advance from Friday's close. Obvious from the chart's pattern, if this return is realized, a move higher is highly unlikely to occur in a straight line. Kirk's commentary included with this chart noted,
"It rarely pays to bet against markets that have bullish plays in motion with a consistent series of higher swing highs and higher swing lows in the follow through. After acquiring its first reversal target this year, a secondary play remains in motion here in an apparent fifth-wave type advance. This chart suggests there is still plenty of upside potential left in the U.S. markets..."
Some additional market charts are included below. The charts note recent breakouts to the upside for the indexes: the NYSE Composite Index, the S&P 500 Index, iShares Europe (NYSE:IEV) and the iShare MSCI Emerging Markets Index (EEM). In short, beyond the U.S., markets around the world seem to be breaking out to the upside as well. 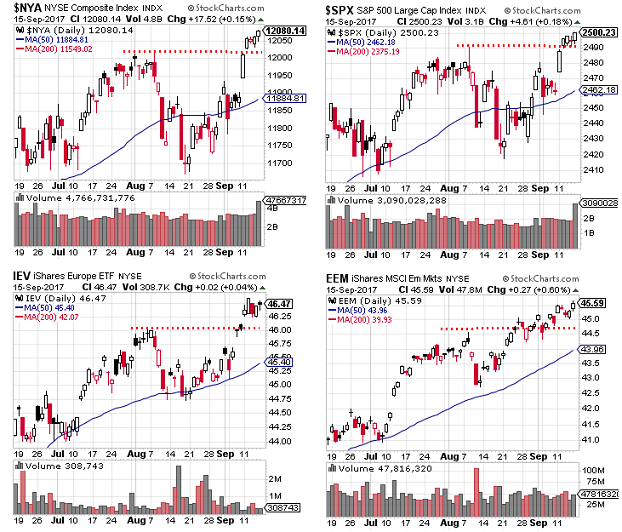
The first two charts in the above chart cluster also show the index moves to the upside are occurring on higher volume as well. The below chart displays the 'common stock only' advance-decline line volume for the NYSE Index. This line also shows a break to the upside above resistance. 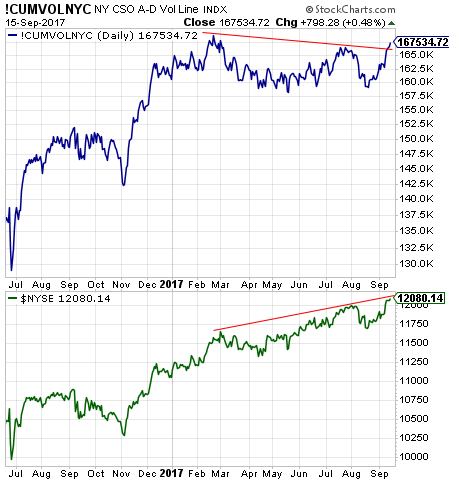
And finally, the last few weeks of September have a tendency to be weaker than the first two. On Wednesday, the market will hear from the Fed following a two day FOMC meeting and important insight might be gleaned from the Fed's statement about the pace of unwinding the Fed's balance sheet. Additionally, the S&P 500 Index closed at 2,500.23 on Friday and these round number levels have a history of resulting in market pauses. The below chart from MKM Partners, and provided by Rachel Shasha, shows the round number level pauses going back to early 2015. 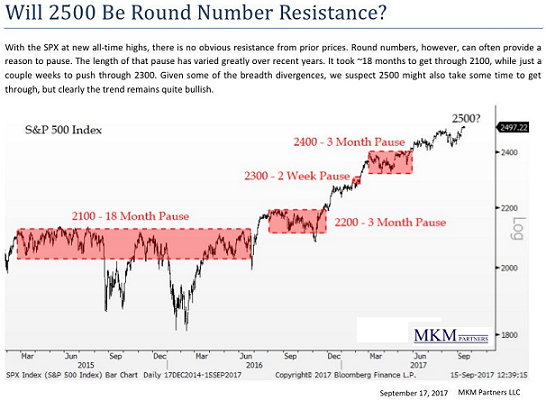
In summary, market valuations do seem elevated, but in a low interest rate environment, these valuations levels do not seem out of line. And as I have noted in earlier posts, valuations alone do not cause corrections. Investments outside of equities are difficult for investors due to the low yields they generate. Certainly, cash and high quality bonds can serve as an important foundation in an equity market pullback, but upside returns in cash and bonds appear to be muted if equities continue to advance higher. The absence of any significant pullback over the last two years is a bit of a concern; however, the market technicals are indicating equities want to move higher. As many have noted, the market is in a very long-term uptrend, and trends tend to persist.
