Key Points:
- US Election continues to buoy safe haven investments.
- EMA bias reverting to bullish.
- Parabolic SAR retains a bullish bias moving forward.
From a fundamental perspective, it’s easy to understand why silver has been staging a relatively consistent recovery recently. Heightened market uncertainty in the lead up to the US presidential election, especially in the last few days, is being felt keenly by safe haven investments. Additionally, the ongoing concerns over the Brexit saga have, more generally, been limiting silver’s downside risks. However, setting fundamentals aside, there is a growing body of technical evidence which suggests that the metal is entering a period of near-term bullishness in the lead up to November 8th.
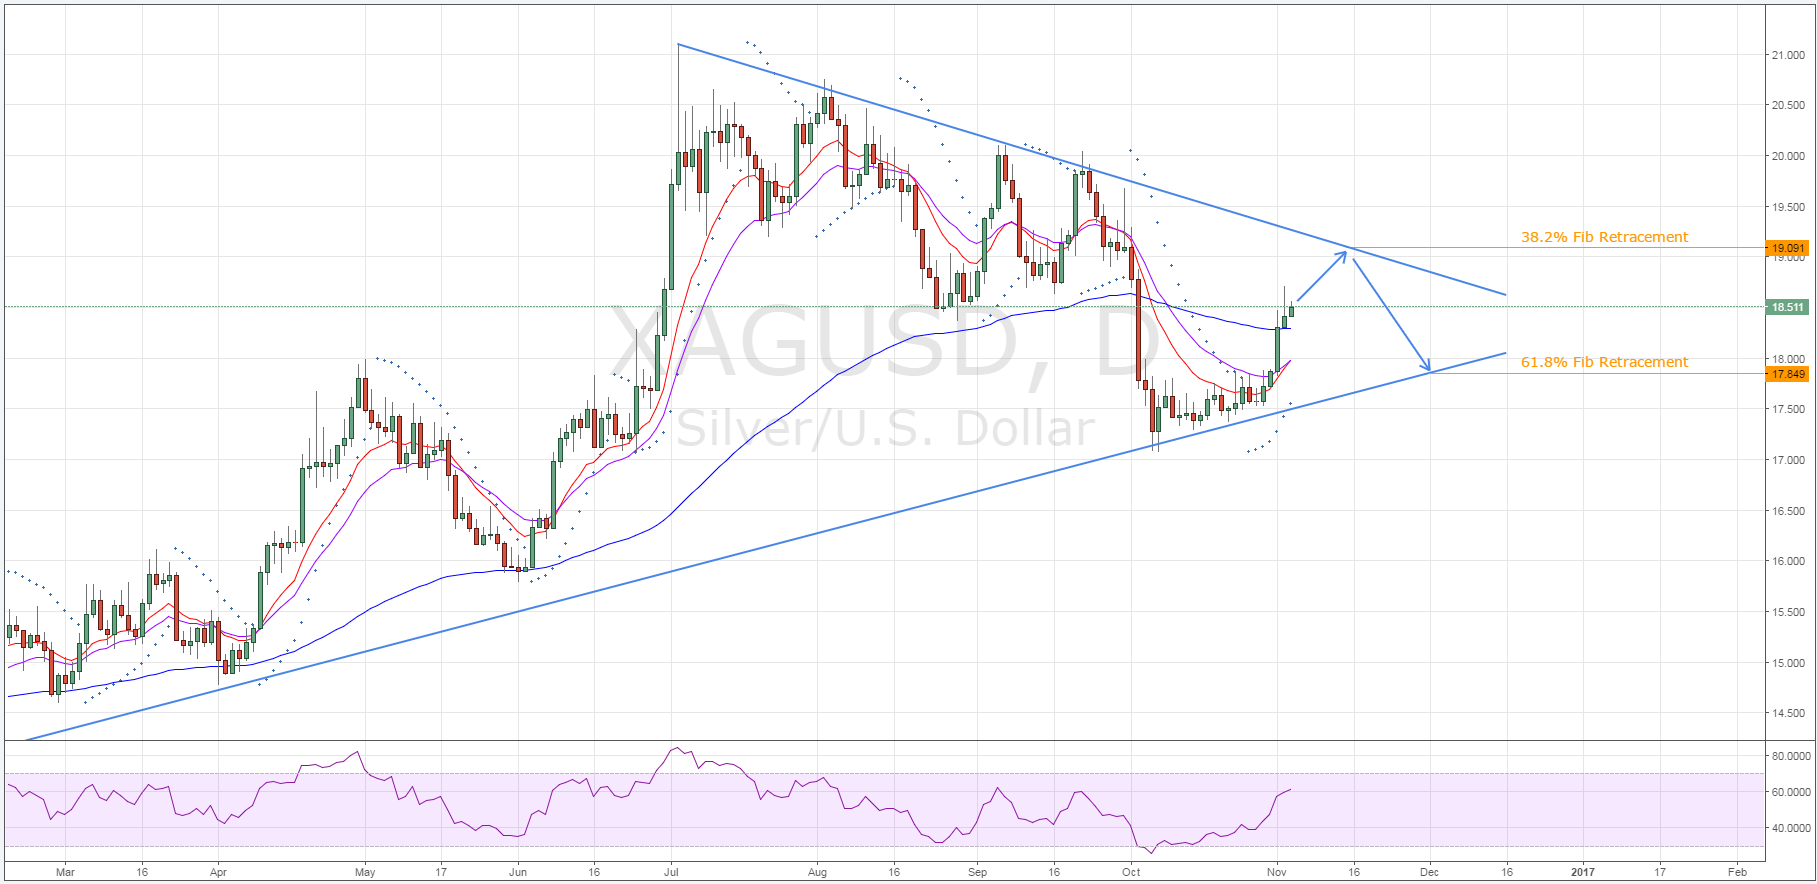
Firstly, silver’s last few surges have brought it back up above the 100 day moving average which should prevent any reversals in the immediate future. In addition to the dynamic support being supplied by this 100 day average, the imminent crossover of the two shorter-term EMA’s will be cementing bullish sentiment. However, EMA activity alone is hardly enough to encourage traders who were stung by October’s flash sell off to re-enter the silver market.
Fortunately, there are a number of other technical measures to which we can look to confirm a bias moving ahead. One of these is the daily Parabolic SAR reading which is still signalling that the near-term uptrend is in full swing. However, more importantly, the overall consolidation pattern is still in place and this indicates that we should see the pair move as high as the 19.091 mark prior to any further bearishness.

As is demonstrated above, silver is contently moving between the long-term inclining trend line and the medium-term declining trend line. Consequently, the metal is forming a loose bullish pennant which should remain intact over the coming week or so. Additionally, these trend lines give us two likely points at which we can expect to see silver prices move as we look ahead. The first point we expect to see is the metal travel towards is the aforementioned 19.091 mark which is also where the declining trend line intersects the 38.2% Fibonacci level. After reaching this price, a reversal should occur which will then see silver decline to the 61.8% Fibonacci level at around the 17.849 price.
Ultimately, as silver approaches the upside constraint, risks of a breakout could become more pronounced. This will especially be the case if Trump continues to narrow the gap in the polls or actually emerges victorious from the election. However, if by some miracle we get to Election Day without another scandal and the polls prove to be correct on who will win the US race, this technical forecast should complete relatively uneventfully.
