A pause in Iraq?
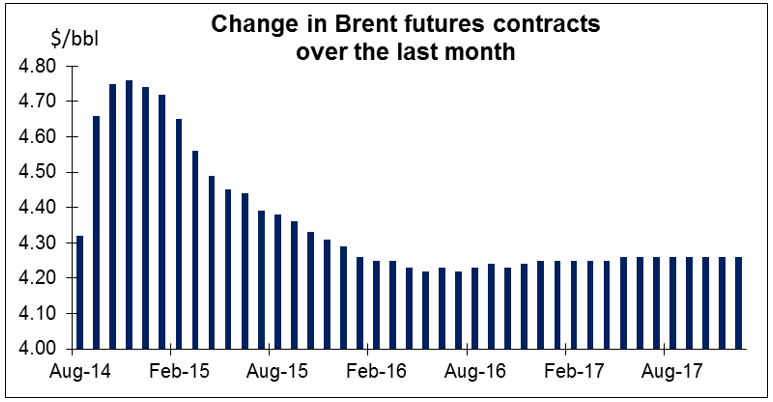
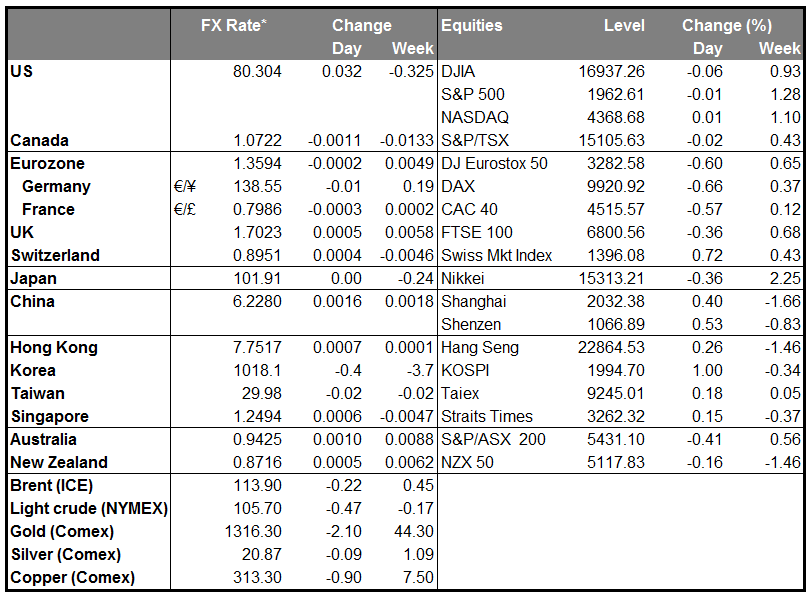
Oil was the major loser overnight on speculation that Iraqi oil production won’t be disrupted by escalating violence in the country. Although the Iraqi army yesterday ceded control of the Baiji refinery in the north, they also recaptured some territory along the border with Jordan and Syria, according to Iraqi state TV. Moreover, the fighting has remained concentrated in the north and center of the country, while the oil industry is concentrated in the south, so there has not been that much disruption to oil exports. The movement in the markets is largely a risk premium that rises and falls with the insurgents’ progress. The change in Brent futures over the last month suggests that the market is most concerned about what will happen this year and not as concerned about the longer-term future of oil prices. Personally though I would not put too much weight on one day’s events in what is likely to be a lengthy battle. Iraq produces 3mn barrels a day of oil, making it the second-largest oil producer in OPEC after Saudi Arabia.
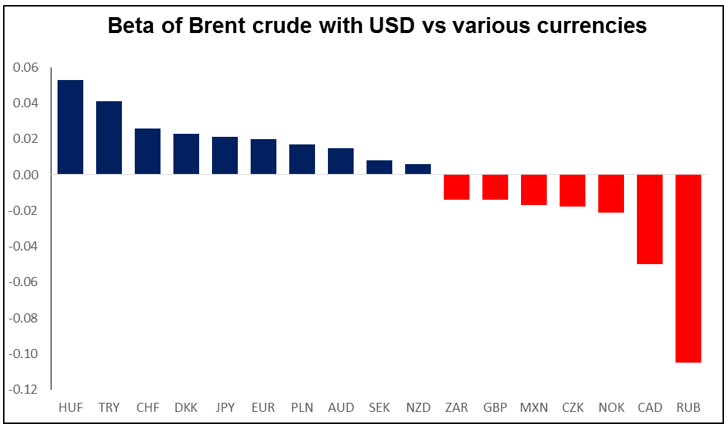
Looking at the betas of currencies with regards to movements in the Brent price over the last two years, we find that HUF, TRY, CHF and DKK (in that order) tend to gain the most vs USD when oil prices decline. On the other hand, the currencies of oil producing countries – RUB, CAD, and NOK – tend to be the best-performing currencies when oil prices are moving up, as one might expect. I have no explanation for why CZK has about the same beta to oil prices as MXN.
The decline in oil was echoed in other commodities, with Copper, Nickel and aluminium all falling. That seems strange given the surprising rise in the June HSBC/Markit manufacturing PMI for China released yesterday, which broke above the 50 “boom or bust” line for the first time this year. The fall probably reflects the continued unwinding of Chinese commodity financing deals. It was announced yesterday that imports of copper into China fell in May. The unwinding of the huge amount of material held in these deals would probably have a strong impact on the market and could presage deeper declines for AUD in the future.
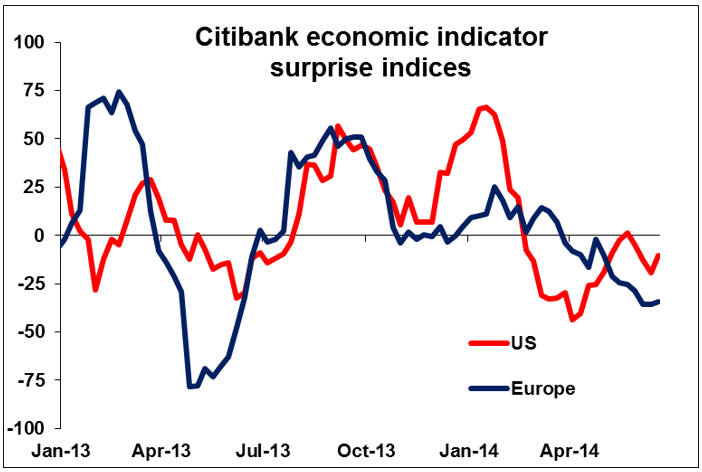
Yesterday’s PMIs showed a widening divergence between the Eurozone and the US. The German PMI was lacklustre, rising only marginally, while the French manufacturing PMI declined at an accelerating pace. In the US however the PMI rose more than expected, as did existing home sales. Overall, the economic surprise index for the Eurozone is pointing down, while that for the US is pointing up. This divergence in economic performance is likely to cap EUR/USD on the upside even while the divergence in inflation (and hence real interest rates) puts a floor on the pair. The result could be just a further period of low volatility.
On Tuesday, the main event will be the German Ifo survey for June. The current assessment index is expected to rise somewhat to 115.0 from 114.8, but the expectations index is estimated to decline marginally to 106.0 from 106.2. The expectations index tends to dominate the effect on the market, so it is possible that the number could depress EUR/USD.
In the UK, the BBA mortgage approvals are expected to have fallen in May.
From the US, the Conference Board consumer confidence index for June is expected to have risen slightly, while the Richmond Fed manufacturing index for the same month is expected to decline to 6 from 7. New home sales for May are expected to be higher at a 4.40mn annualized pace, up from 4.33mn in April. On the other hand, two indices of home prices -- Federal Housing Finance Agency (FHFA) and S&P/Case-Shiller house price indices -- are forecast to show that the pace of increase in house prices slowed in April.
We have five speakers scheduled on Tuesday. Bank of England Governor Mark Carney testifies in parliament on inflation report. ECB Governing Council member Ewald Nowotny and ECB Executive Board member Benoit Coeure speaks, Philadelphia Fed President Charles Plosser and New York Fed President William Dudley also speaks.
The Market
EUR/USD remains near the 1.3587 barrier
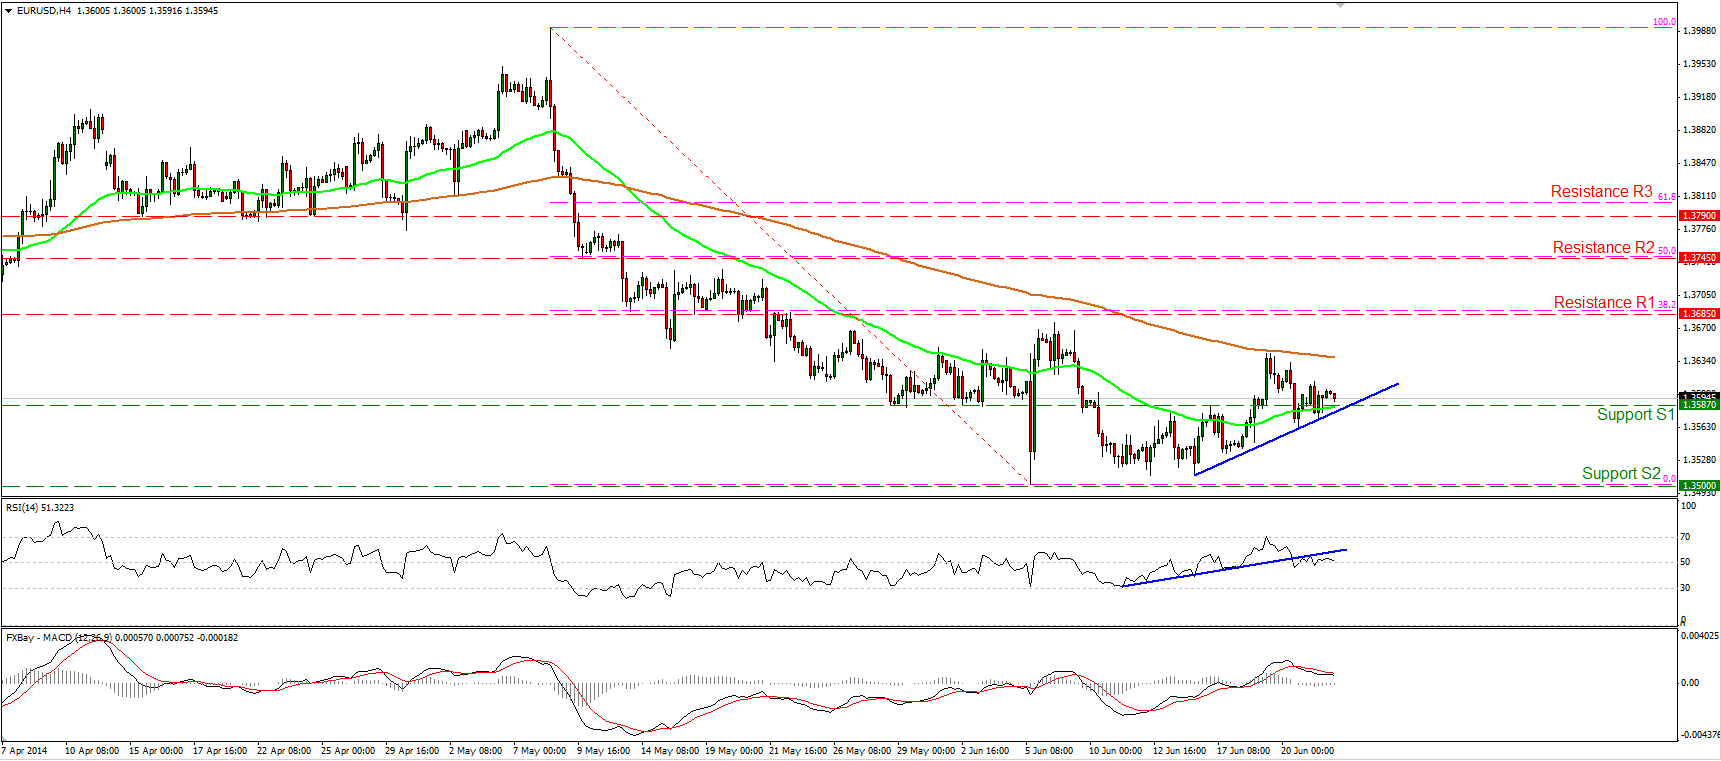
The EUR/USD failed to move higher, with the worse-than-expected PMIs from France, Germany and Eurozone as a whole keeping the rate pinned down close to the 1.3587 (S1) barrier and the blue short-term support line. The RSI broke below its uptrend line and is now ready to fall below 50, while the MACD, although in its positive territory, remains below its trigger line. Given that, I would keep a neutral stance for now. A price dip below the blue short-term support line may confirm the weakness signs provided by our momentum studies and target the psychological zone of 1.3500 (S2). In the bigger picture, the pair is trading below the 200-day moving average, keeping the long-term outlook negative. However, we need a dip below 1.3500 (S2) to reinforce the downtrend.
• Support: 1.3587 (S1), 1.3500 (S2), 1.3475 (S3).
• Resistance: 1.3685 (R1), 1.3745 (R2), 1.3790 (R3).
USD/JPY within a symmetrical triangle
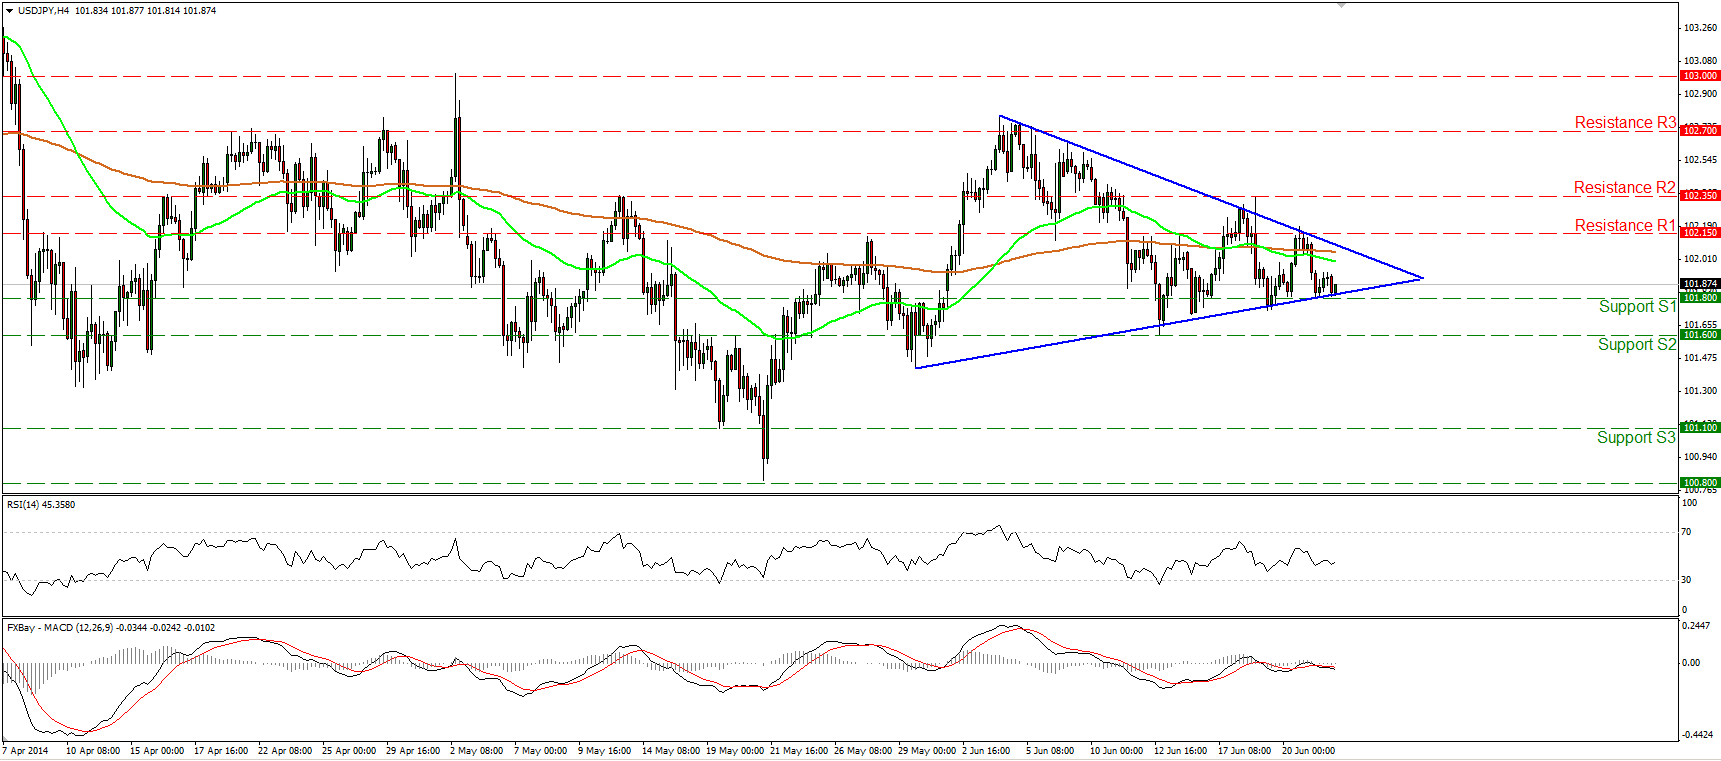
The USD/JPY moved lower on Monday, to find support at the lower bound of a possible symmetrical triangle. Since the rate remains within the formation, I see a neutral picture. Only a decisive move out of the pattern could give clearer indications about the pair’s forthcoming short-term direction. Both the 50- and the 200-period moving averages are pointing sideways, while both our short-term momentum studies lie near their neutral levels, confirming the non-trending phase of the currency pair.
• Support: 101.80 (S1), 101.60 (S2), 101.10 (S3).
• Resistance: 102.15 (R1), 102.35 (R2), 102.70 (R3).
EUR/GBP within a short-term range
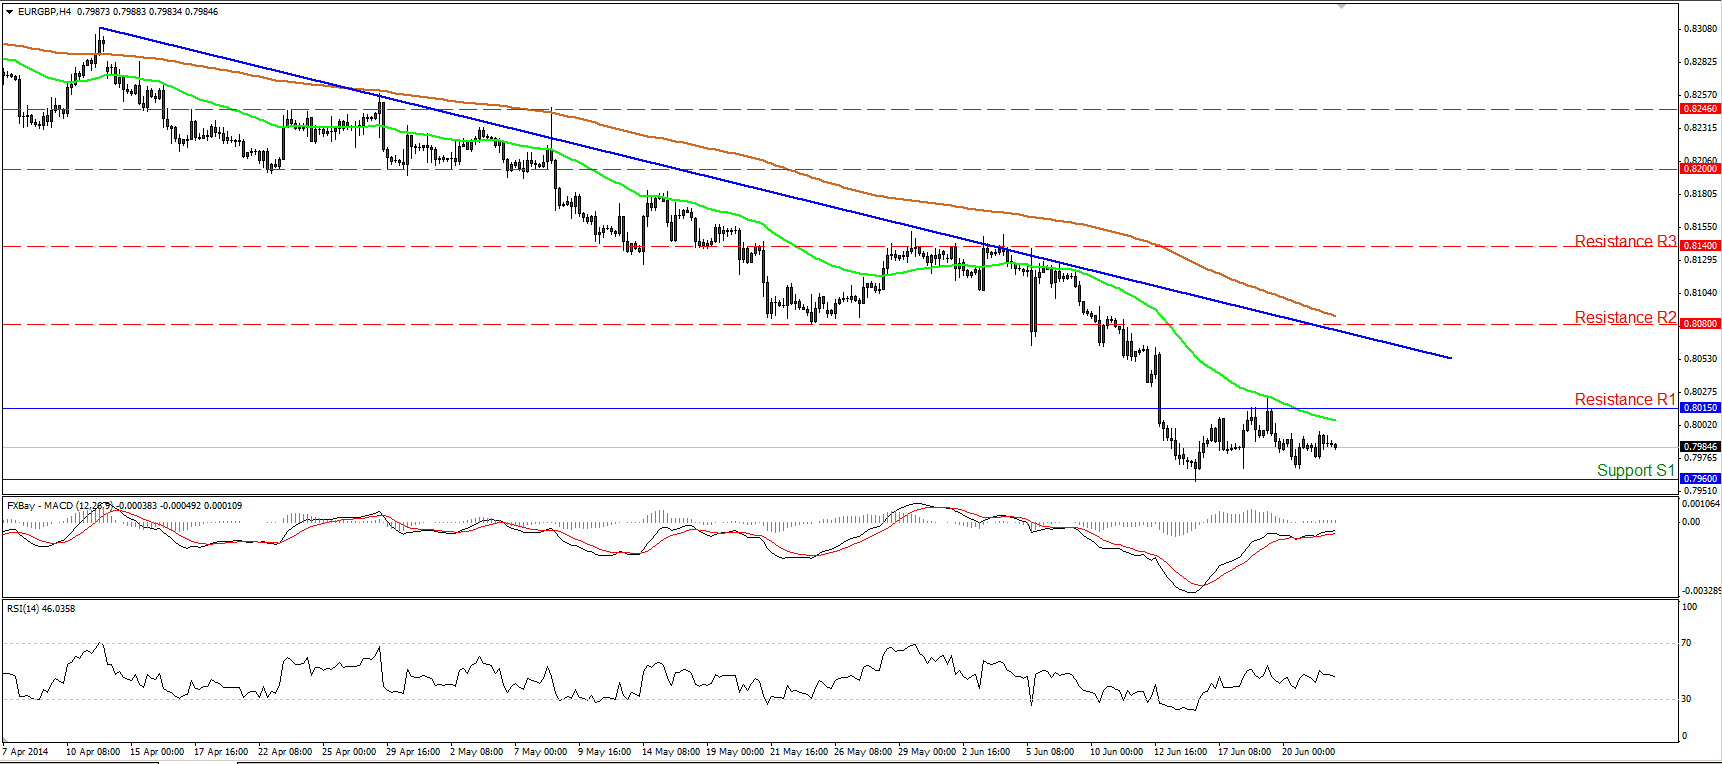
The EUR/GBP remains within a range between the support of 0.7960 (S1) and the resistance of 0.8015 (R1). Considering that the MACD lies above its trigger line, I cannot rule out a price move above 0.8015 (R1), maybe towards the next hurdle of 0.8080 (R2). Nonetheless, the pair is trading below the blue downtrend line and below both the moving averages, thus I would consider any upside moves as corrective waves before the bears prevail again. A dip below the 0.7960 (S1) is needed to confirm a forthcoming lower low and trigger the continuation of the downtrend. Zooming on the 1-hour chart, our hourly momentum studies lie near their neutral levels, confirming the near-term consolidation of EUR/GBP.
• Support: 0.7960 (S1), 0.7900 (S2), 0.7815 (S3).
• Resistance: 0.8015 (R1), 0.8080 (R2), 0.8140 (R3).
Gold still in a consolidative mode
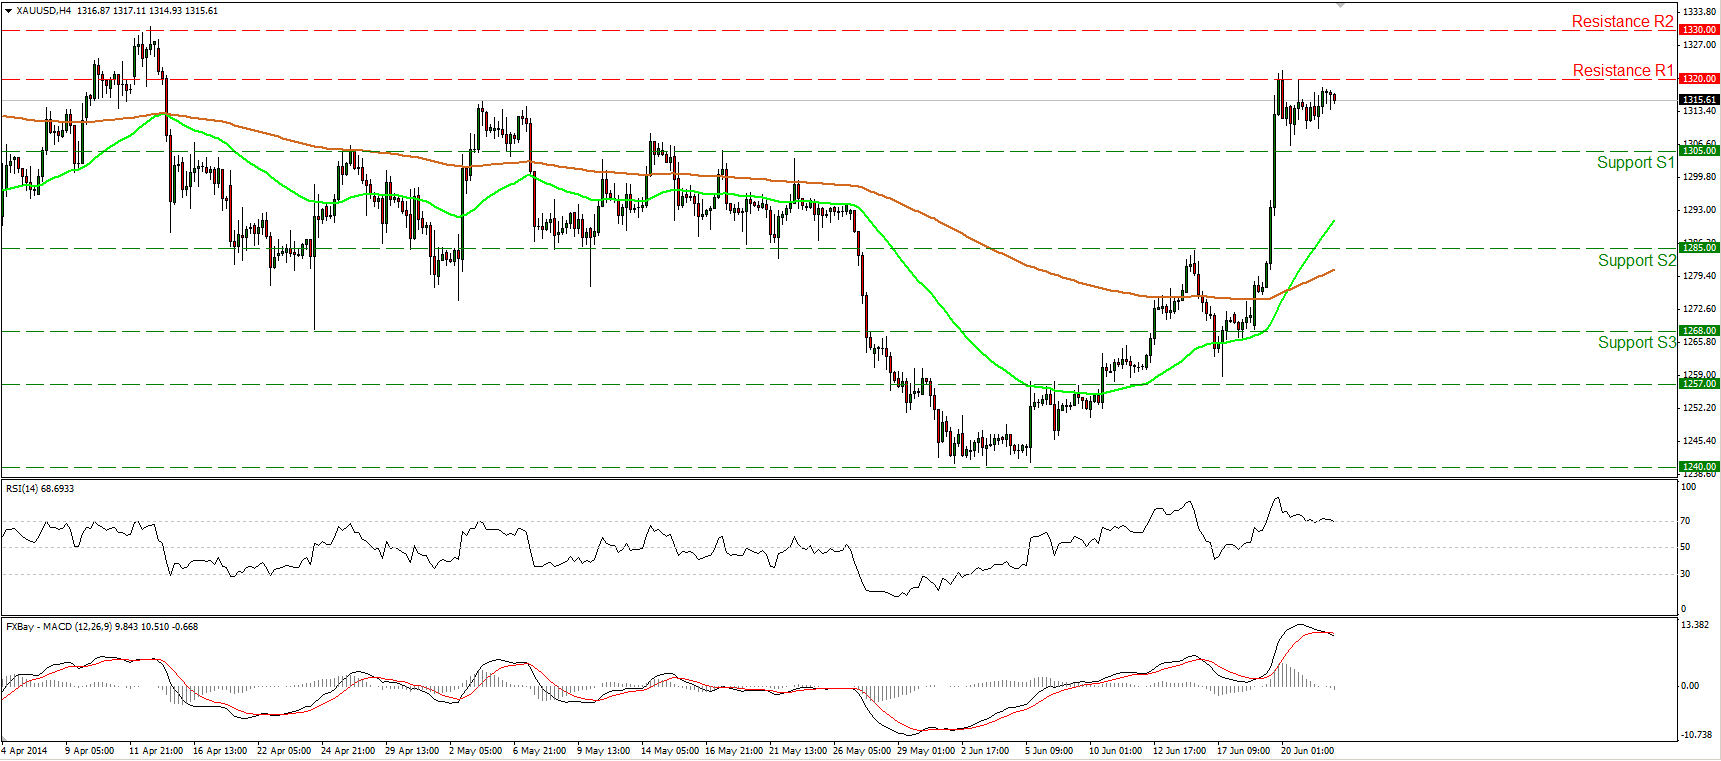
Gold continued consolidating on Monday, remaining between the support barrier of 1305 (S1) and the resistance of 1320 (R1). The RSI moved lower and seems ready to exit overbought conditions, while the MACD fell below its signal line. As a result, further consolidation or a downside wave are possible in the near future. However, as long as the structure of the precious metal is higher highs and higher lows, the technical picture remains positive and I would consider any downside waves as corrective waves, at least for now.
• Support: 1305 (S1), 1285 (S2), 1268 (S3) .
• Resistance: 1320 (R1), 1330 (R2), 1342 (R3).
WTI breaks below the uptrend line
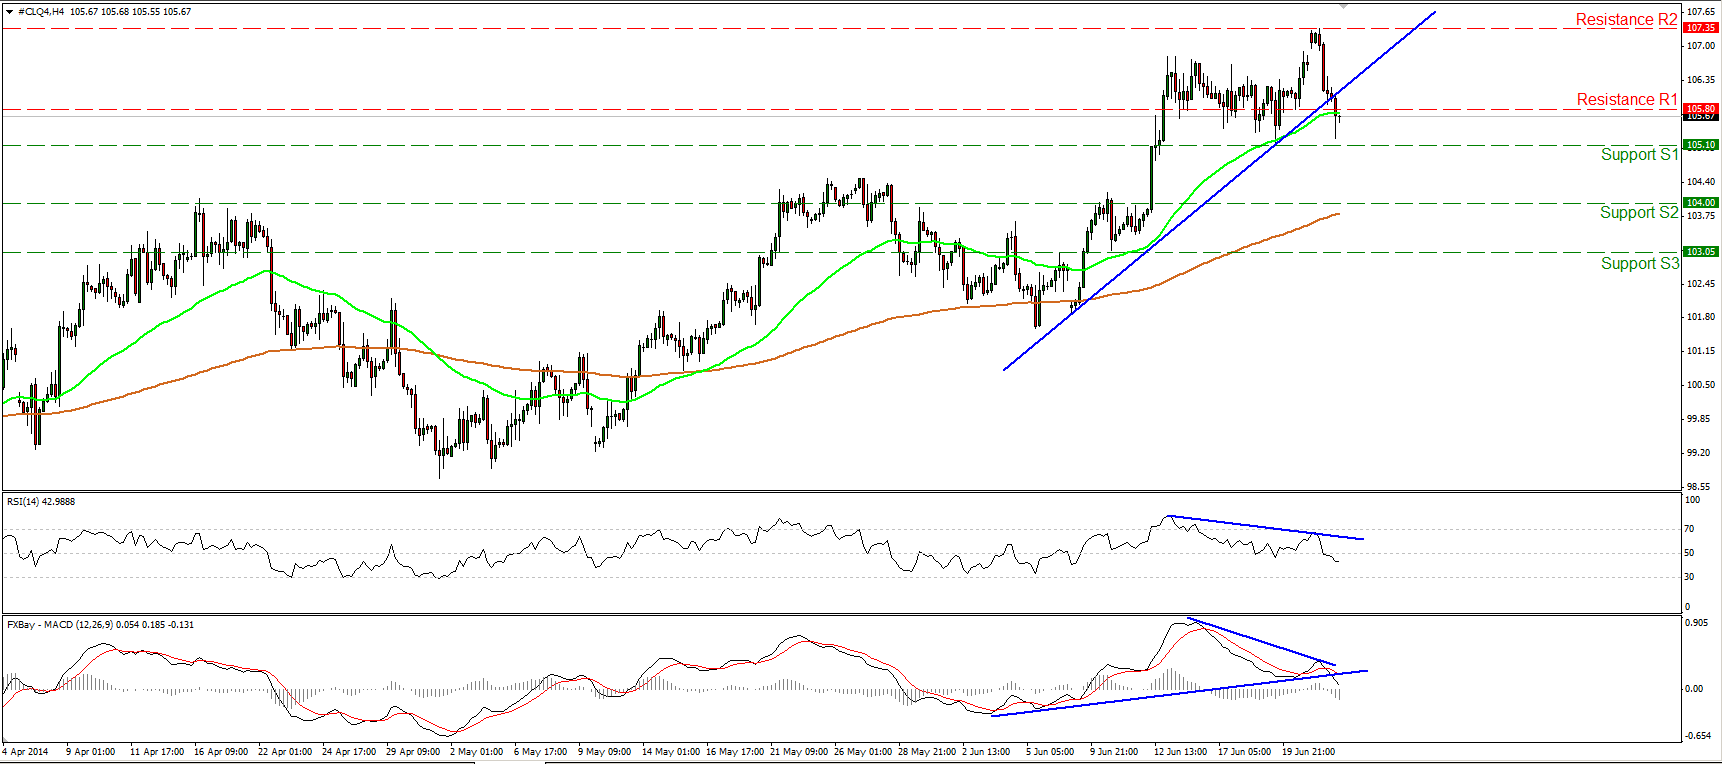
WTI failed to maintain its price above 107.00. WTI found resistance at 107.35 (R2) and fell sharply to violate the blue short-term uptrend line. If the bears are strong enough to push the price below 105.10 (S1), I would expect them to trigger extensions towards the next hurdle at 104.00 (S2). Moreover, negative divergence is identified between both our momentum studies and the price action, while the MACD fell below its trigger and below its support line. On the daily chart, we can identify a bearish engulfing candle formation, increasing the likelihood for the continuation of the decline.
• Support: 105.10 (S1), 104.00 (S2), 103.05 (S3).
• Resistance: 105.80 (R1), 107.35 (R2), 108.00 (R3).

