About a month ago I noted that the market was approaching an important decision point. To wit:
"Since the end of the 2012, coincident with the Federal Reserve's implementation of QE3, the market has been on an unrelenting bullish trajectory that has defied weakening underlying economic data and market fundamentals. In other words, price momentum has deviated from underlying fundamentals as investor exuberance has escalated.
While price volatility has certainly increased in recent months, I have maintained a fully allocated portfolio model as the primary bullish trend has remained intact. However, it is worth noting that the current bullish trend is extremely long by historical standards."
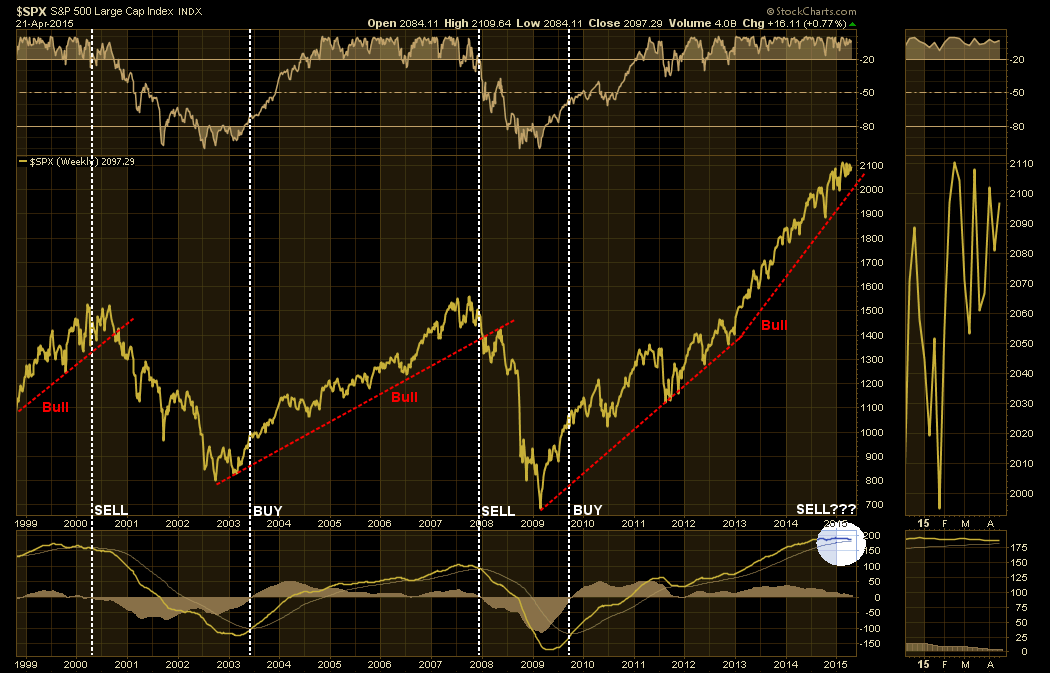
"I have also noted the historical buy and sell points as noted by long term MACD trends. Importantly, the MACD indicator is very close to issuing only its 5th signal since the turn of the century. While this does not mean that the next "financial crisis" is set to be unleashed upon the financial world, such signals have only been associated with previous major market tops."
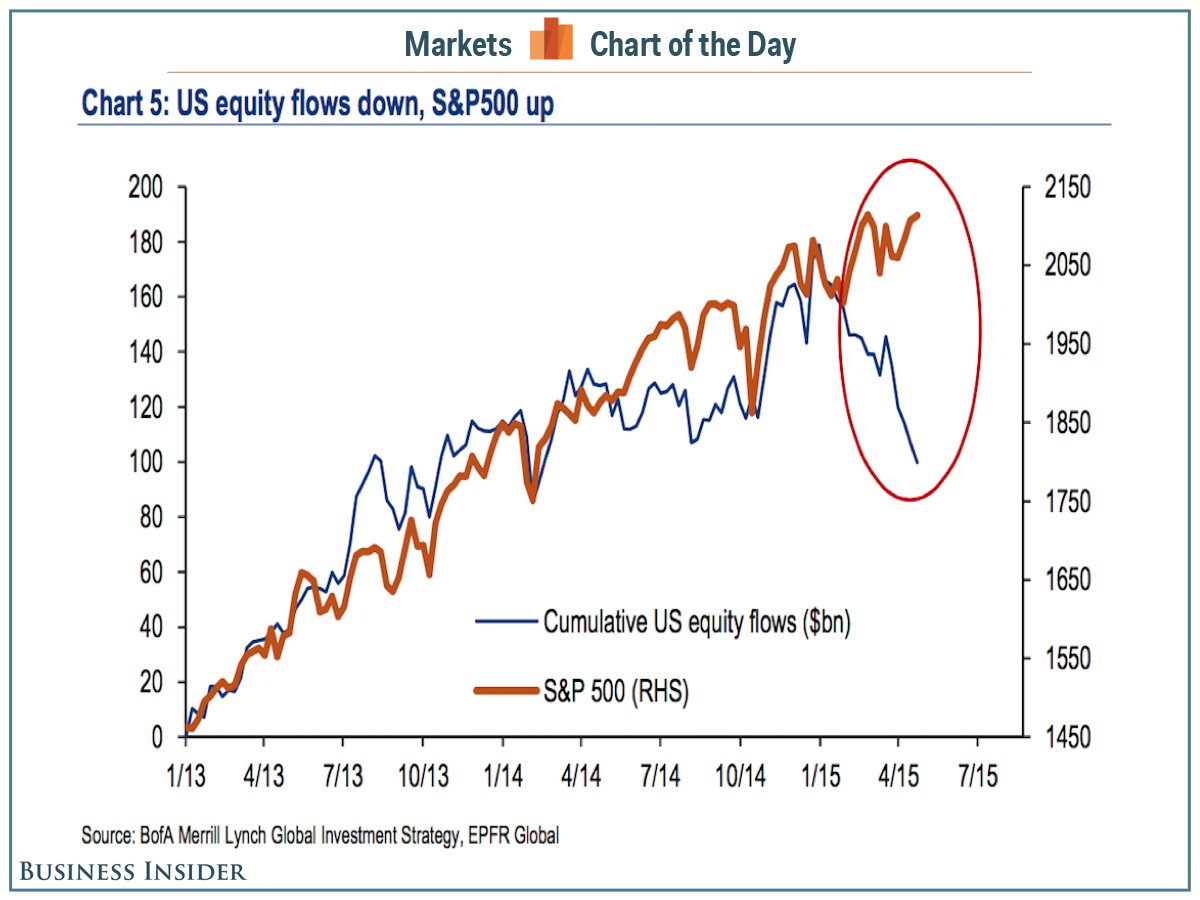
From the broader macro-technical perspective, the current bullish trend remains very much intact despite deterioration in market liquidity, equity outflows and weak fundamentals. The chart below, courtesy of Business Insider, tells the tale very clearly.
It is with this background that I want to update the technical underpinnings of the market. In my previous report, I showed the following chart of the market remaining trapped in a tightening pattern of higher lows and lower highs. This type of action is like the compression of spring.
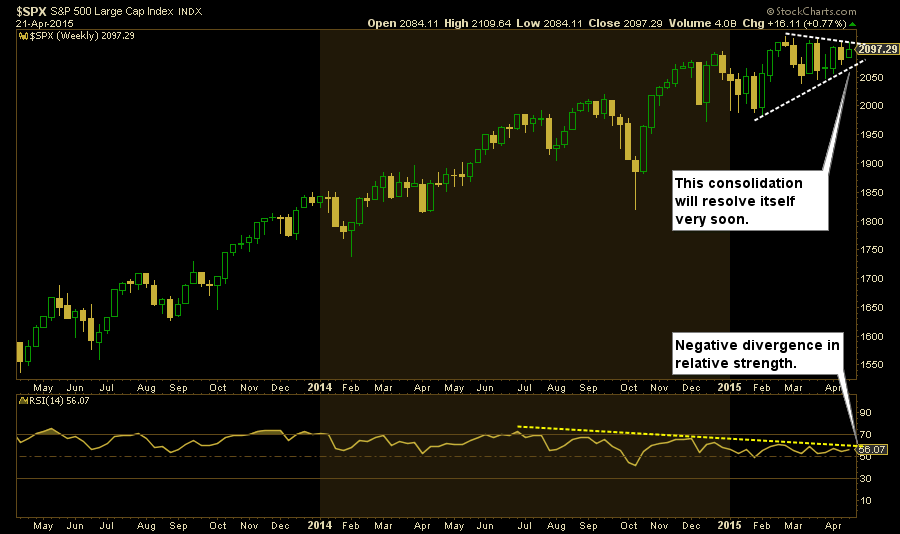
I stated previously that I expected the consolidation to resolve itself to the upside due to the underlying momentum in the markets. As I discussed in this past weekends newsletter, the resolution of that consolidation has now been achieved.
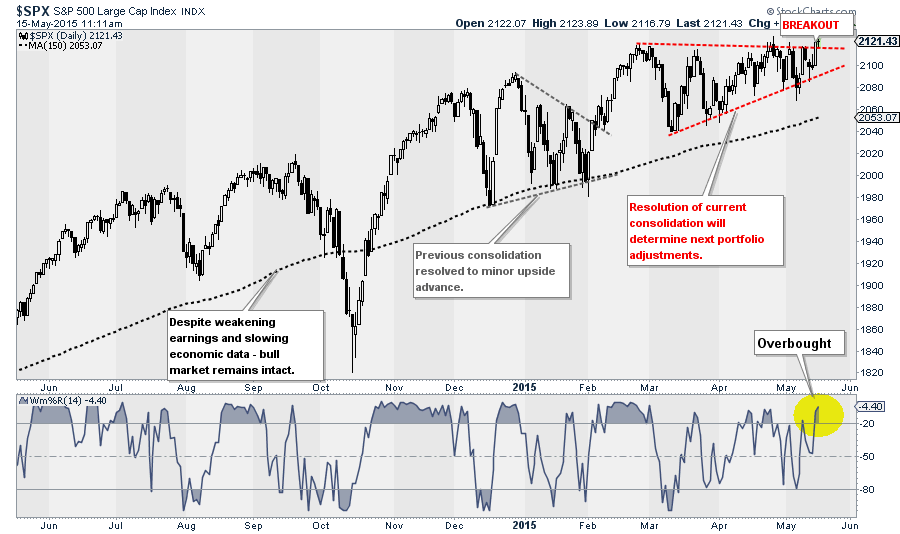
"This [breakout] suggests that portfolios should remain FULLY ALLOCATED to equities for the time being as the tendency for the markets remains upwardly biased.
WARNING: This does NOT mean that this will be the case for the next three (3) months or the next year. It just means that the markets are still moving higher at the current time. However, investors should continue to monitor portfolios and manage risk going forward as things will change. As I have discussed previously, this does NOT mean that all market risk is now resolved, or that investors should return to their complacent slumber.”
Since the portfolio model remains fully allocated to the market, the break out of the consolidation simply confirms that the "bulls" remain in charge of the market. No action is required other than routine portfolio risk management protocols as previously discussed in "Bull Market Most Overbought/Leveraged In History."
It Is What It Is...
I want to be quite clear about my comments. My job is to manage portfolios in a manner to participate in markets when they are rising and protect capital when they are not. Therefore, focusing on WHY markets are rising is of little importance because portfolios are already invested. My attention needs to be directed toward WHAT may cause markets to buckle unexpectedly. It is because of that analysis that I am often viewed as a "bear." In reality, I am agnostic, and because I am discussing the markets bullish breakout it does NOT mean that I have somehow changed my views.
IT IS WHAT IT IS. Denying the fact markets are rising, and failing to participate in the short term, is just as damaging as participating in a sharp market decline. In BOTH events, I am destroying client capital.
The reality is that the breakout to the upside of the consolidation range IS BULLISH and suggests that markets will go higher in the SHORT TERM.
However, time frames are crucially important. Analysis of short-term market actions are like "7-day weather forecasts." They are accurate within the first couple of days but start needing revisions as new data is received. Whiile the breakout could last a day, a week, or a month -- it will eventually end. The breakout DOES NOT mean that we are beginning the next great secular bull market and that investors should pile in with reckless abandon.
As I noted previously, the underlying technicals of the market continue to suggest an environment where downside risk grossly outweighs the potential for reward.
"In order to reinforce the importance of the "buy/sell" indications driven by price momentum, I have stepped the chart out to a much longer time frame on a MONTHLY price basis. As shown, the MACD indicator at the bottom of the chart is confirmed by the price momentum oscillator just above it. Since 1999, there have only been four prior signals with each being critical turning points in the markets."
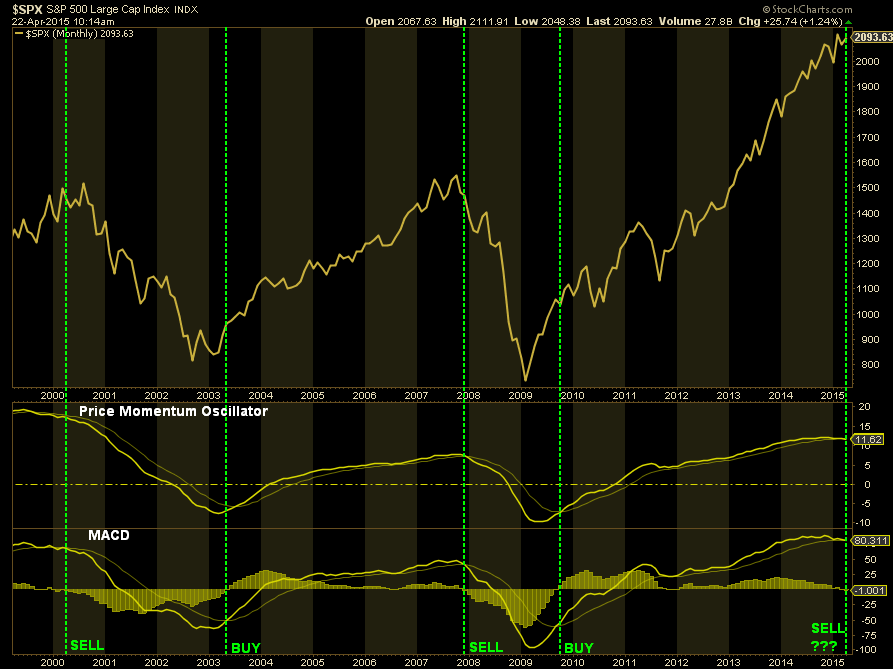
"Furthermore, the markets are long overdue for a more substantial market correction of 10%, or more, following one of the longest unabated bull market runs in history."
Duration Mismatch
One of the most critical mistakes that investors repeatedly make is trying to apply long-term macro analysis to their portfolio management. As I discussed last time:
This is where the disconnect exists between fundamental and economic analysis and portfolio risk management exists. While there is interesting discussion daily on the current economic or fundamental backdrop as it relates to the markets, the reality is that these measures are of little use in actually managing portfolios in the short-term where investors actually operate."
This is what is called a "duration mismatch."
Fundamental and economic data points are extremely slow to mature, and even slower to have an impact on investor behavior. I have frequently written about the fallacy of long-term investment objectives and actual investor behaviors. As repeatedly shown by Dalbar studies, despite what investors and advisors say about long-term investing, the reality is that actions clearly speak of much shorter-term realities.
Case in point is the ongoing debate about valuations. Valuations are currently at the second highest level in history (discussed here). Because the market continues to rise in price, due primarily to a flood of Central Bank liquidity, it is has been concluded that "this time is different." It isn't.
While the longer-term market dynamics suggest the risk to investment portfolios, being overweight cash in a rising market will lead to "career risk" for portfolio managers and advisors. The markets are sending short-term bullish signals that should be viewed constructively in the short-term, and portfolios should remain tilted more heavily towards equity exposure.
This does not mean that the current bull market will not eventually end - it will. The longer the bull market advances unabated, the greater the risk becomes of a significant correction. This is where prudent portfolio management and risk controls will pay large dividends over the media's "buy and hold" mentality.
