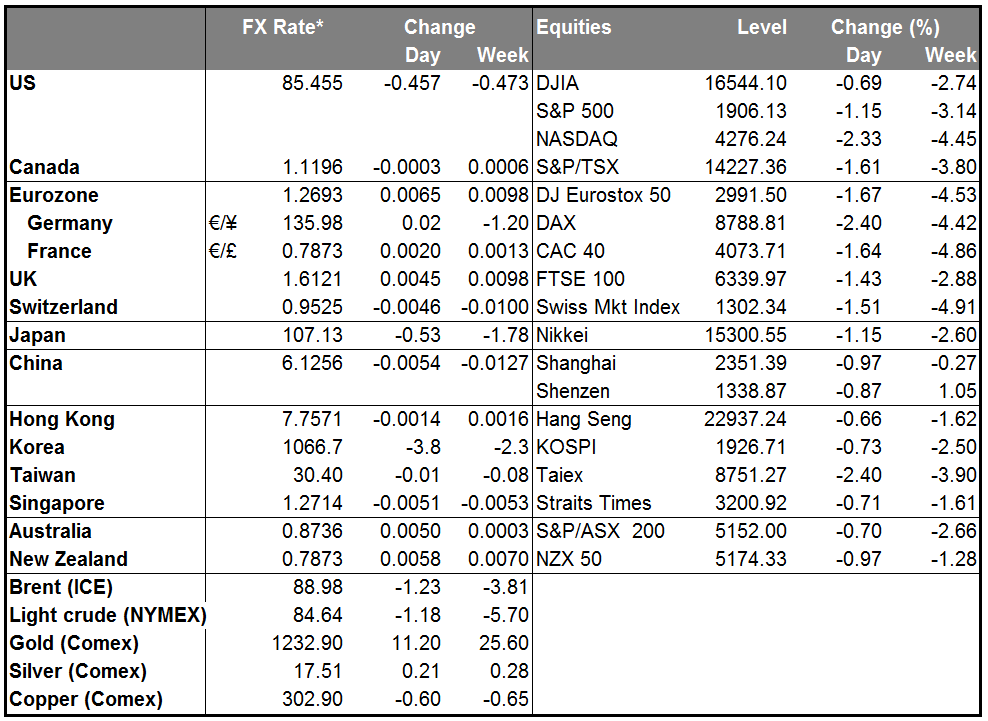
Yen gaining on risk aversion The dollar was opening little changed in Europe from its levels Friday morning. The only noticeable trend within the G10 was a strengthening yen. This stands to reason, as stock markets around the world – including Japan – fall. USD/JPY is strongly positively correlated with Japanese stocks (USD/JPY has a.56 correlation with Nikkei over the last five years, while EUR/JPY has a .45 correlation with S&P 500), so it’s normal behavior for the yen to strengthen when the stock markets fall. A quick search turned up only a handful of tiny stock markets that rose on Friday – Peru, Jamaica, Ukraine, Serbia, Latvia, etc. In Asia today, only Pakistan.
It seems to me that attempts by US officials to reassure the markets are backfiring. Over the weekend, Fed Vice Chair Stanley Fischer said that if foreign growth is weaker than anticipated, the Fed might “remove accommodation more slowly than otherwise.” Other officials echoed his concern about the impact that weak growth elsewhere, particularly in Europe, might have on the US. While perhaps his comments and others were meant to reassure the markets that the Fed was not oblivious to these concerns and would not raise rates too quickly, the comments seem to be undermining confidence in the US recovery. With the S&P 500 sitting just on top of its 200-day moving average (1905.22, vs Friday’s close of 1906.13), stock markets – and the yen – are looking finely balanced. (Although to be fair, the last two times the S&P 500 broke through the 200-day moving average from the top in June and Nov. 2012, there was no dramatic further decline.)
I would recommend caution for those investors who are using JPY as a funding currency. On the other hand, the equities that usually suffer most when currencies decline are the commodity currencies (AUD, NZD, CAD) and SEK. Short AUD/JPY might be one way to express a negative view on global equities through currencies, although given the risk of a surprise in the Chinese indicators coming out this week (see below), CAD/JPY might be a better bet. CAD/JPY is strongly correlated with US stocks (0.63)
China announced a huge reduction in its trade surplus in September from August’s record levels. Exports rose more than expected, while imports soared. This is good news for everyone. The strong exports will support growth in China, while strong imports and a reduced trade surplus mean the benefits of that growth are being distributed both among China’s trading partners and within China (that is, households are benefitting more as well). AUD and NZD were both rising vs USD into the figure and continued to gain afterwards, although AUD/USD remains below Friday’s opening level, perhaps because of the impact of lower global stock markets.
China will issue some of the most important releases this week, including money and bank lending growth, consumer and producer prices, foreign direct investment, and business sentiment. The market will want to see if the problems in the property market have depressed activity further. In that respect, the bank lending figures will be closely watched.
Today’s activity likely to be light: Today may be relatively quiet as Japan was on holiday in the morning (Sports Day) and in the afternoon both the US (Columbus Day) and Canada (Thanksgiving) are on holiday, although the markets are still open in the US. As for indicators, there are no major indicators coming out from the Eurozone, the UK nor the US. There are three speakers: ECB Executive Board member Peter Praet Bundesbank President Jens Weidmann in Europe and Chicago Fed President Charles Evans. Weidmann will speak on “Conditions for a Stable Currency Union;” it will be interesting to hear how his vision on this matter differs from ECB President Draghi’s. The two have expressed quite different views on what needs to be done to keep the Eurozone together.
Rest of the week: There are no major central bank policy meetings scheduled for this week. There will be however the usual round of speakers, including Fed Chair Janet Yellen herself (Friday) and several of her FOMC colleagues, including Messrs. Bullard, Lockhart, Plosser, Evans, Tarullo and Kocherlakota. ECB President Draghi will give an introductory speech at an ECB conference on Wednesday and RBA Deputy Gov. Debelle speaks Tuesday at an investment conference.
As for the indicators, on Tuesday, we get UK’s CPI for September and the forecast is for the inflation rate to ease again. On top of the recent poor data, this will most likely push expectations for BoE tightening further back, probably after the country’s general elections in May. From Germany we get the ZEW survey for October. The current and the expectations situation are expected to decline, reflecting the concerns about the nation possibly falling into recession. Eurozone industrial production for August is anticipated to drop in line with the fall in bloc’s strongest economies.
On Wednesday, the highlight will be the UK unemployment rate and average weekly earnings, both for August. The consensus is for the unemployment rate to decline, while the average weekly earnings are projected to accelerate. That could boost GBP. In the US, we get retail sales for September. Both the headline figure and sales excluding the volatile items of autos and gasoline are forecast to decelerate. The Fed releases the Beige book.
From Canada, building permits plunged in August, while housing starts rose modestly in September. The market will be waiting to see the existing home sales for September to have a clearer view of the nation’s housing market activity. ECB President Mario Draghi will speak twice on Wednesday in Frankfurt, and he may repeat his pledge that the ECB is “ready to alter the size and/or the composition of our unconventional interventions” but this time to a different audience.
On Thursday, we get the Eurozone’s final CPI for September and from Canada, manufacturing sales for August. We have several Fed speakers scheduled as well.
Finally on Friday, the spotlight will be on Fed Chair Janet Yellen’s keynote speech at a Boston Fed conference on “Inequality of Economic Opportunity.” As for the indicators, from the US we get building permits and housing starts both for August. In Canada, CPI for September is due out.
The Market
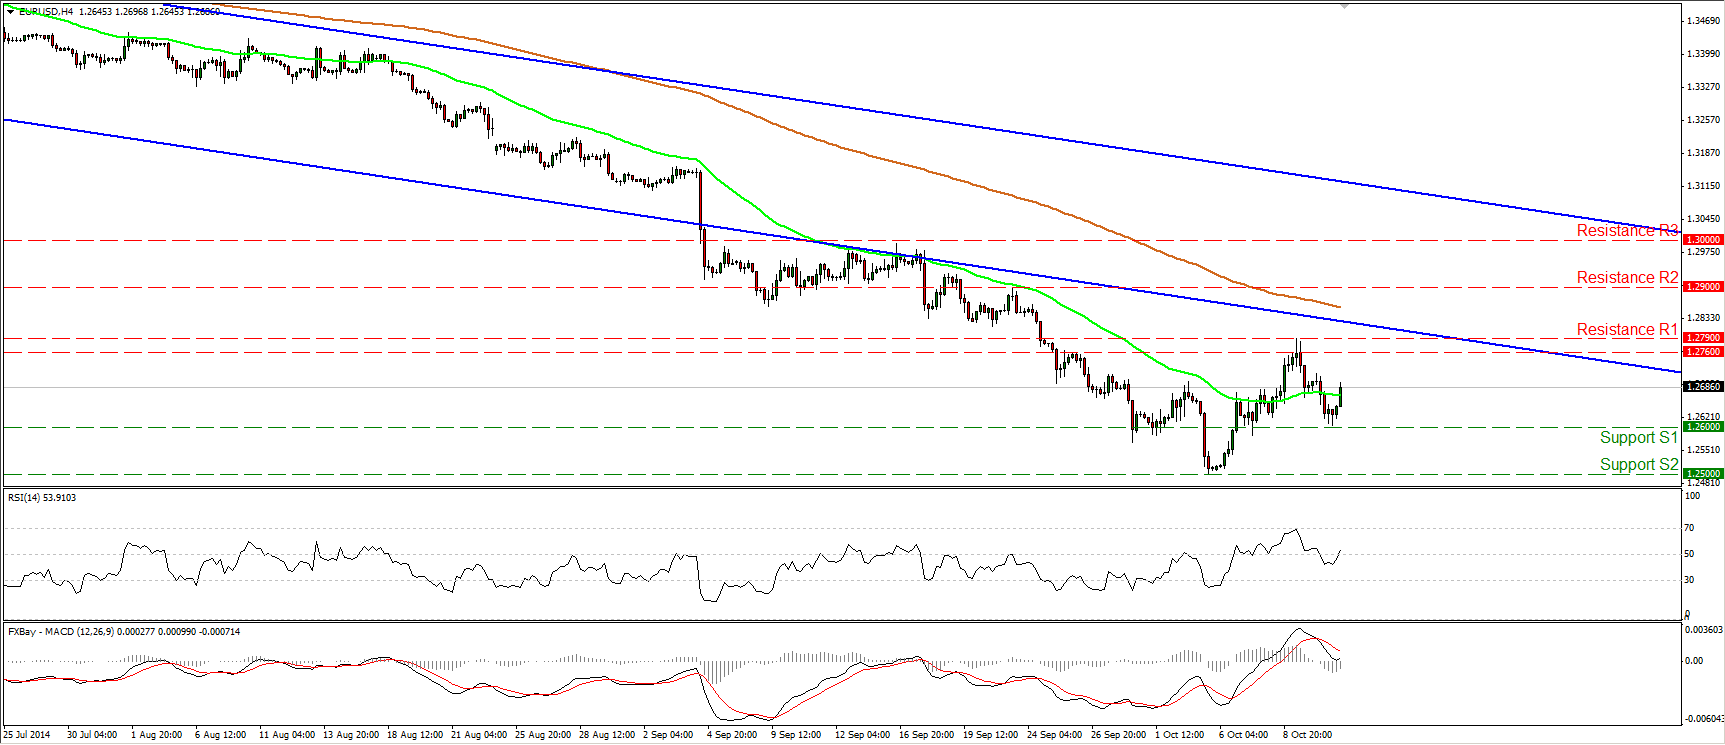
EUR/USD rebounds from near 1.2600
EUR/USD rebounded from near the 1.2600 (S1) line during the Asian morning, printing a higher low. I would now expect the pair to challenge once again the resistance zone of 1.2760/90. The near-term momentum studies also favor an upward bounce. The RSI crossed back above its 50 line and is pointing up, while the MACD found support at its zero line and appears willing to move above its trigger in the close future. Only a dip below 1.2600 (S1) is likely to confirm that the 3rd – 9th October corrective wave is completed at 1.2790 (R1). Such a move could target once again the psychological zone of 1.2500 (S2), which coincides with the 76.4% retracement level of the July 2012- May 2014 major advance. On the daily chart, as long as the price structure remains lower peaks and lower troughs below both the 50- and the 200-day moving averages, I will maintain the view that the overall path remains to the downside. Hence, I will treat last week’s up move or any extensions of it as a corrective phase for now.
• Support: 1.2600 (S1), 1.2500 (S2), 1.2465 (S3)
• Resistance: 1.2790 (R1), 1.2900 (R2), 1.3000 (R3)
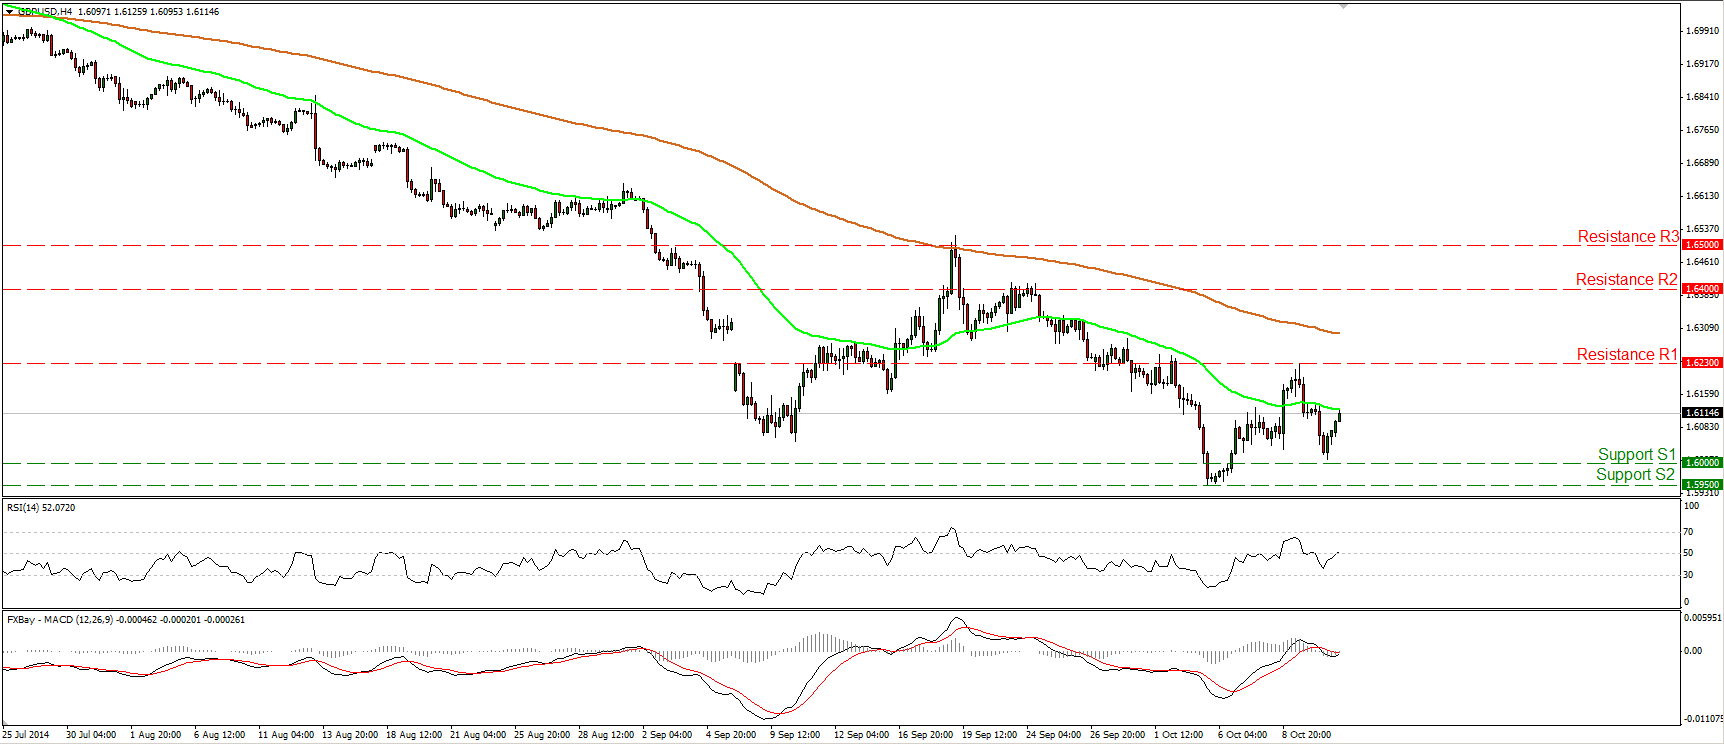
GBP/USD finds support fractionally above 1.6000
GBP/USD found some buy orders a few pips above the psychological line of 1.6000 (S1) and rebounded strongly to trade near the 50-period moving average. Taking a look at our near-term oscillators, I see that the RSI moved above its 50 line and is pointing up, while the MACD appears willing to obtain a positive sign again. These momentum signs amplify the case for the continuation of the up wave, perhaps for another test near the resistance hurdle of 1.6230 (R1), the high of last Thursday. As far as the longer-term trend is concerned, I will repeat for the umpteenth time that as long as Cable remains below the 80-day exponential moving average, I see a negative overall picture. Nevertheless, I also see positive divergence between the daily momentum indicators and the price action, something that indicates decelerating bearish momentum. I would wait for more actionable negative signs before getting again confident about the overall downtrend.
• Support: 1.6000 (S1), 1.5950 (S2), 1.5860 (S3)
• Resistance: 1.6230 (R1), 1.6400 (R2), 1.6500 (R3)
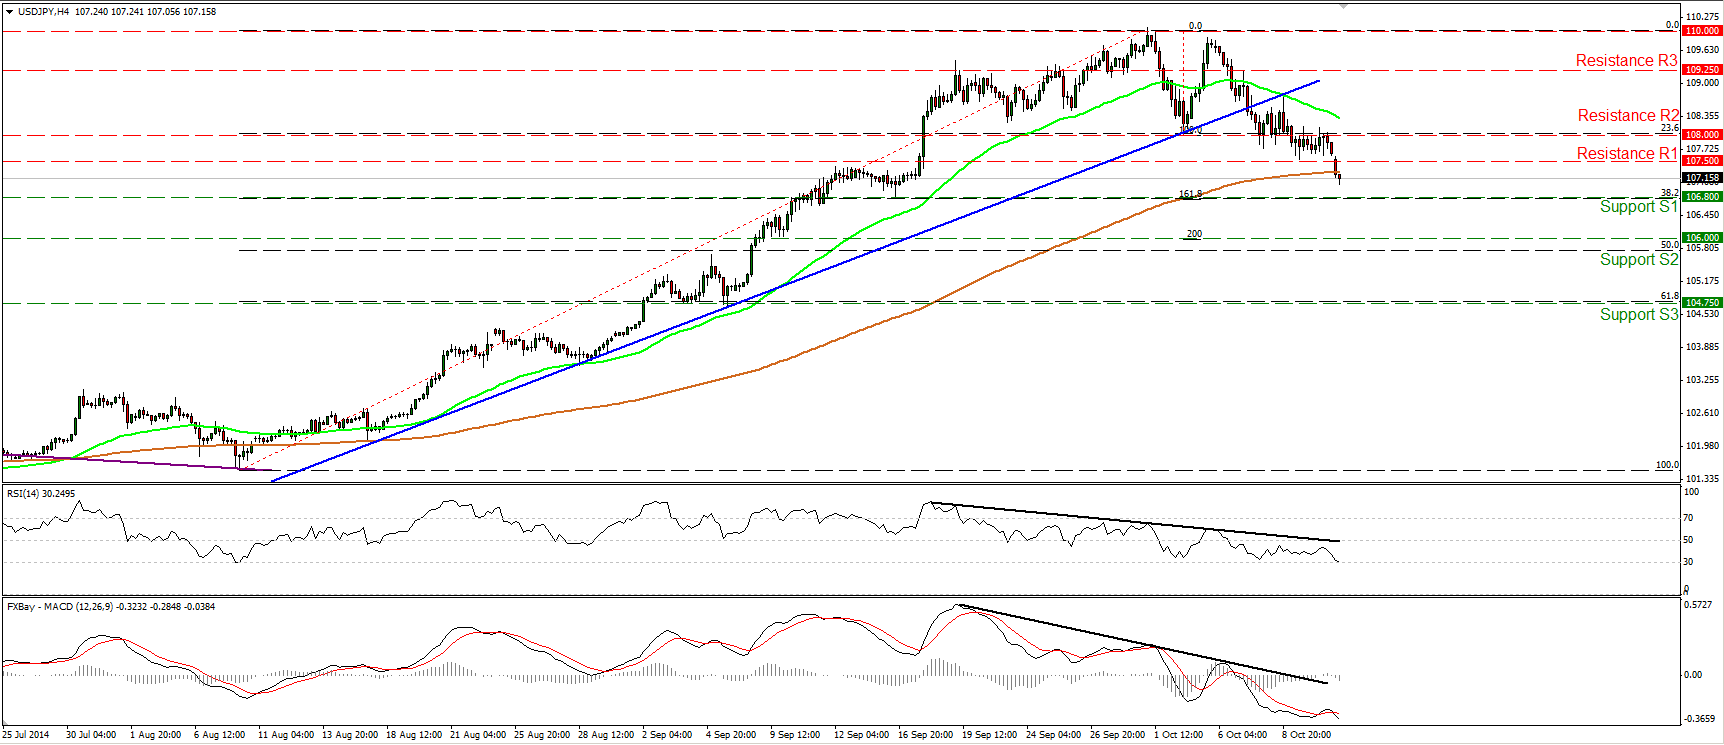
USD/JPY continues its tumble
USD/JPY moved lower after testing the 108.00 line as a resistance. This confirms my view that we have the completion of a double top formation and enhances the chances for further declines in the near future. I still expect the bears to challenge the low of the 16th of September at 106.80 (S1), which happens to be the 161.8% extension level of the double top’s width. That level also coincides with the 38.2% retracement of the 8th August – 1st October up move. Another dip below here could set the stage for extensions towards the 106.00 (S2) line, which is the 200% extension of the pattern’s width. On the weekly chart, last week’s candle closed negative, confirming the hanging man stick mentioned in my previous comments. This, together with the fact that the 14-week RSI moved lower after dipping below its 70 line, increases the possibilities for the beginning of a downside corrective phase.
• Support: 106.80 (S1), 106.00 (S2), 104.75 (S3)
• Resistance: 107.50 (R1), 108.00 (R2), 109.25 (R3)
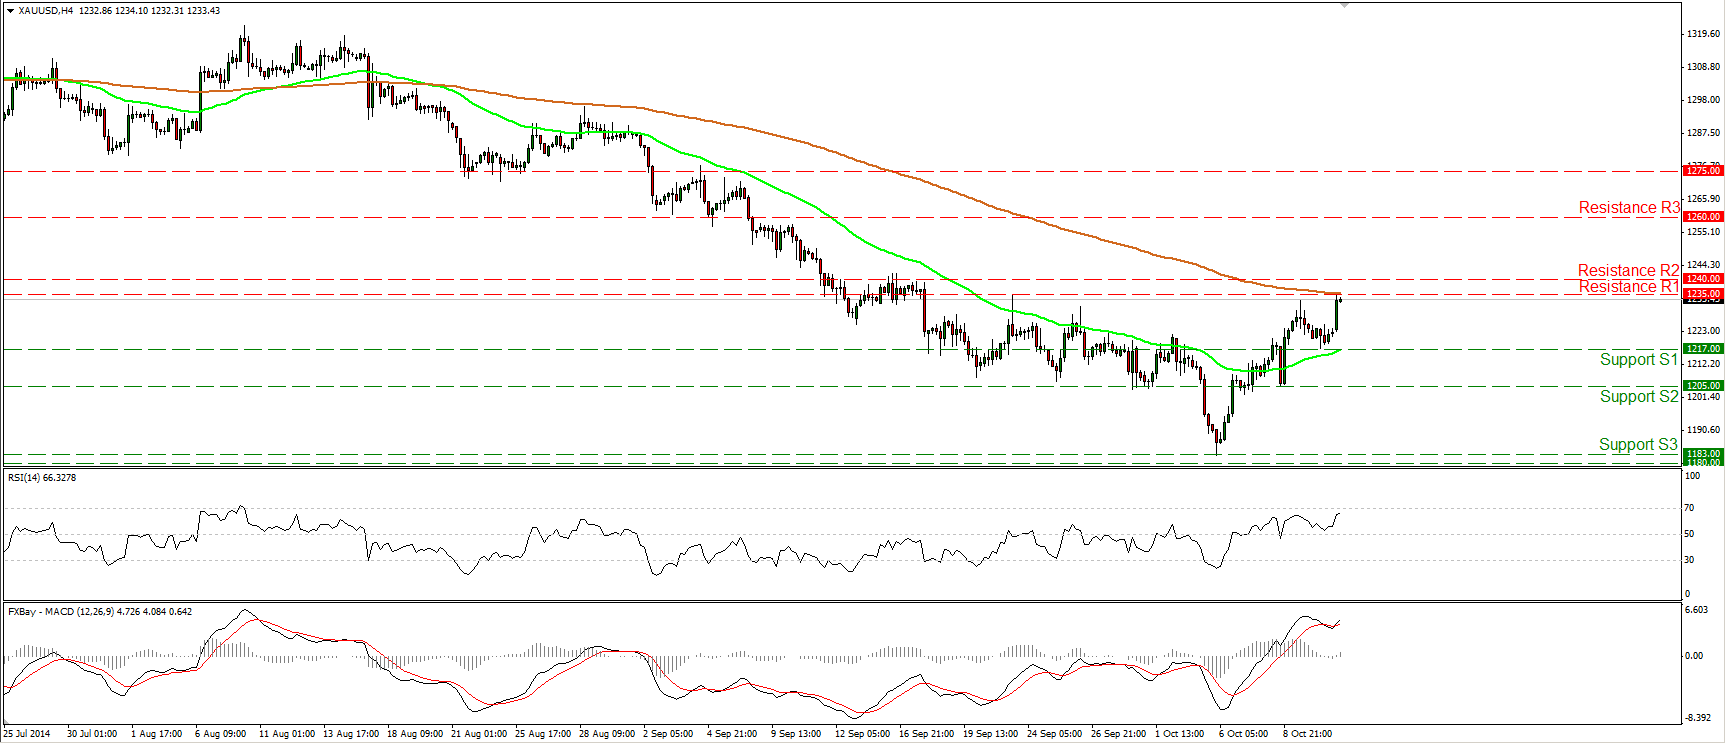
Gold prints a higher low
Gold moved higher during the Asian morning Monday, printing a higher low at 1217 (S1). During the early European morning, the precious metal looks ready to challenge the resistance zone of 1235/40 and the 200-period moving average. A clear and decisive move above that resistance zone is likely to pave the way for our next resistance barrier, at 1260 (R3). The notion is also supported by both our daily momentum indicators. The 14-day RSI crossed above its 50 line and is pointing up, while the daily MACD, although negative remains above its trigger. As far as the broader trend is concerned, I would maintain my “wait and see” stance for the same reasons I mentioned last week. On the 6th of October, the yellow metal rebounded strongly from the critical support zone of 1180/83, defined by the lows of June and December 2013, but the absence of any bullish trend reversal signals makes it too early to argue about any uptrend scenarios, in my view.
• Support: 1217 (S1), 1205 (S2), 1183 (S3)
• Resistance: 1235 (R1), 1240 (R2), 1260 (R3)
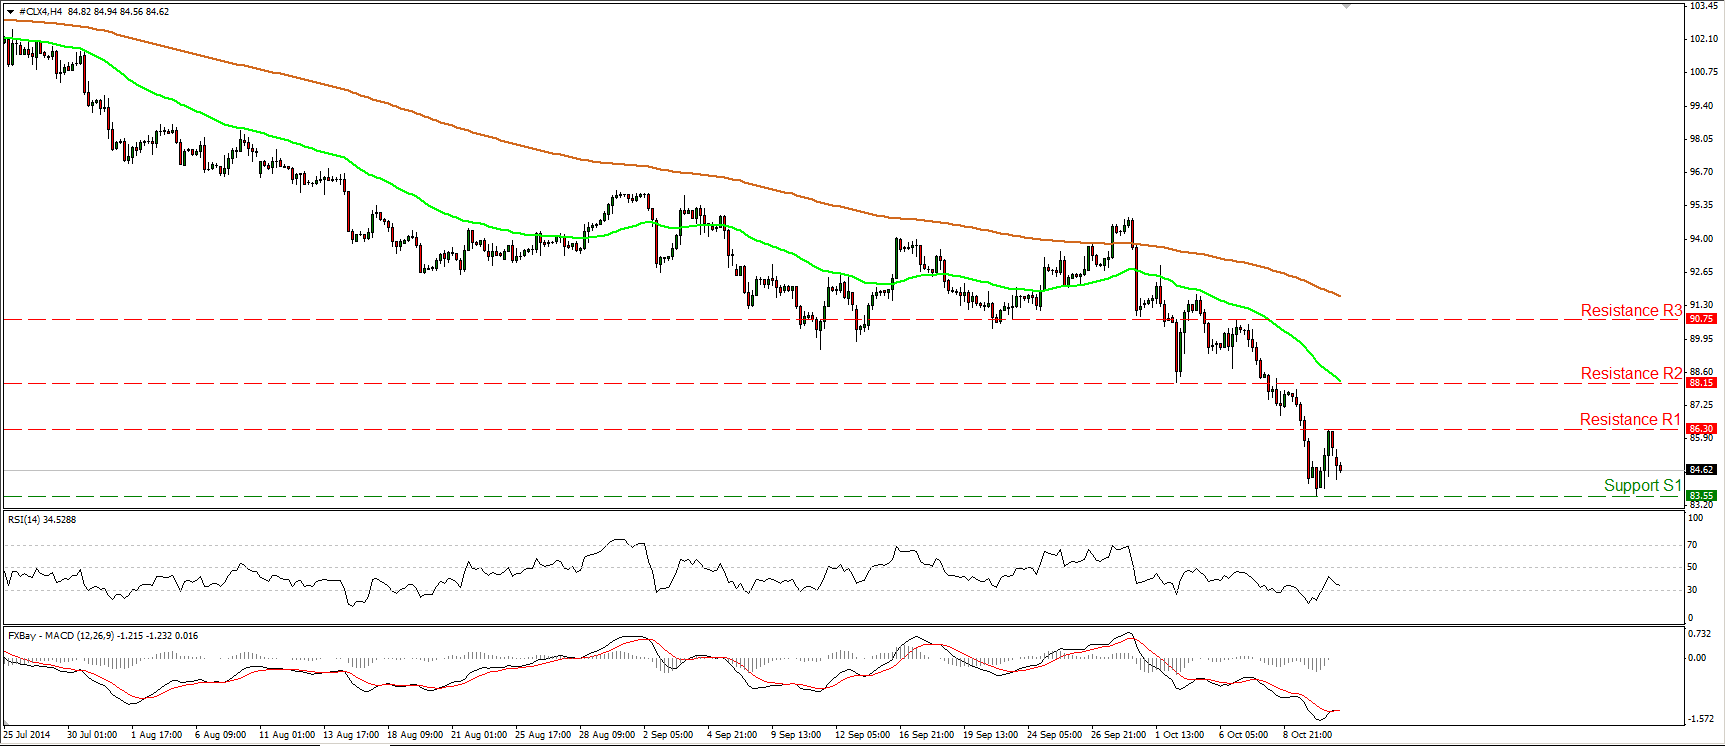
WTI finds resistance at 86.30
WTI declined after finding resistance at 86.30 (R1) and at the time of writing is heading towards the support line of 83.55 (S1), defined by Friday’s low. If the bears are strong enough to overcome that hurdle, I would expect them to see scope for extensions towards the low of the 2nd of July 2012, near the 82.00 zone. On the daily chart, as long as the price structure remains lower highs and lower lows below both the 50- and the 200-day moving averages, the overall trend remains to the downside, in my view.
• Support: 83.55 (S1), 82.00 (S2), 80.00 (S3)
• Resistance: 86.30 (R1), 88.15 (R2), 90.75 (R3)


