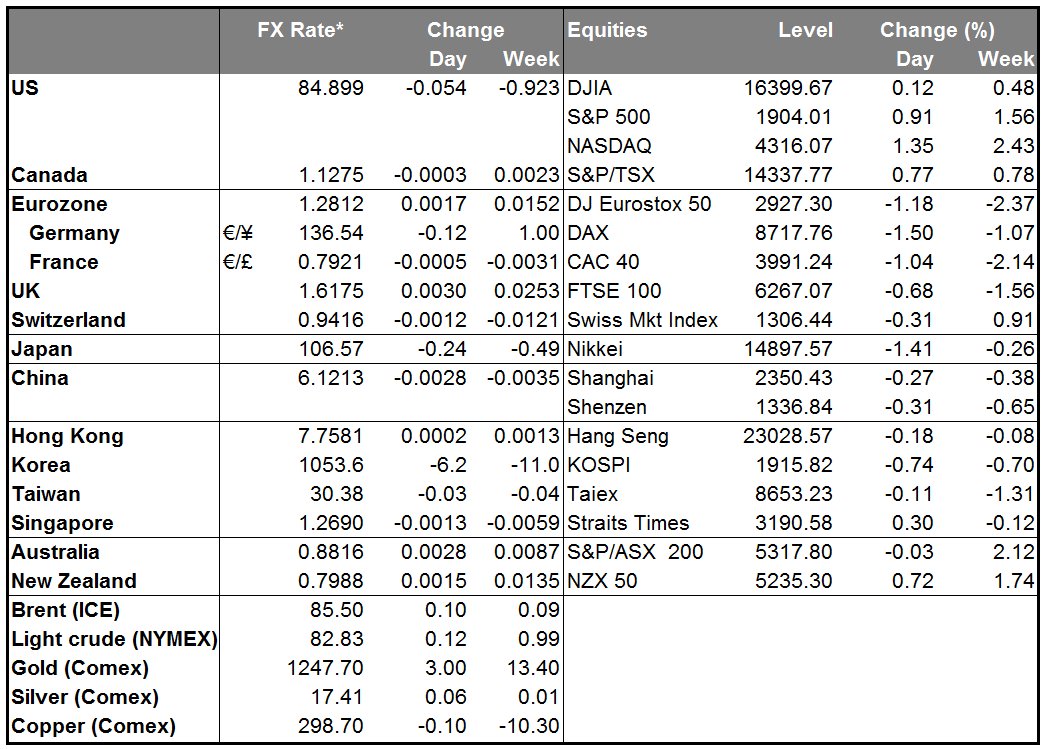
Europe in turmoil, US going smoothly The ECB confirmed that it had started buying covered bonds. It bought French and Spanish bonds, but yields of peripheral sovereigns rose nonetheless (Spain up 9 bps, Italy up 10 bps, Portugal up 18 bps), perhaps because the purchases were too small (estimated around EUR 800mn). By contrast, the Fed bought USD 1.1bn of Treasuries with no fanfare whatsoever. The ECB’s purchases also did nothing to encourage European stock markets, which were down across the board on weak earnings results. Stocks in the US managed to recover on the day as the VIX index steadily declined, and Fed funds rate expectations eased a bit in the long end.
Despite the better performance of US markets, the dollar weakened against most of its G10 counterparts. USD/JPY fell the most, partly in reaction to Friday’s rally and in part tracking the fall in Tokyo stocks. PM Abe was hit by the resignations of two female Cabinet members after allegations of financial impropriety. These scandals may hurt Abe’s public support, which is important as he nears the deadline for deciding whether to raise the consumption tax again as scheduled to 10% from 8%. The majority of the public oppose the tax hike, but the markets like the idea. If he’s forced to back off from the hike in order to keep his popularity, the market may see that as the end of so-called “Abenomics.” In fact that could strengthen the yen, as stocks might fall in response, but on the other hand, it could force the BoJ to redouble its efforts to jumpstart the economy through monetary stimulus, which would weaken the currency. In other words, the long-term impact is unclear.
Gold rallied on hopes that demand will improve ahead of the Hindu Diwali festival on Wednesday and the start of the Indian wedding season. In my view, “hope” is not a trading plan.
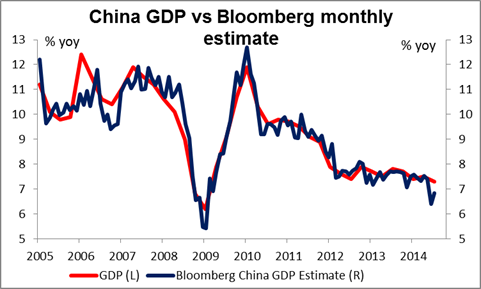
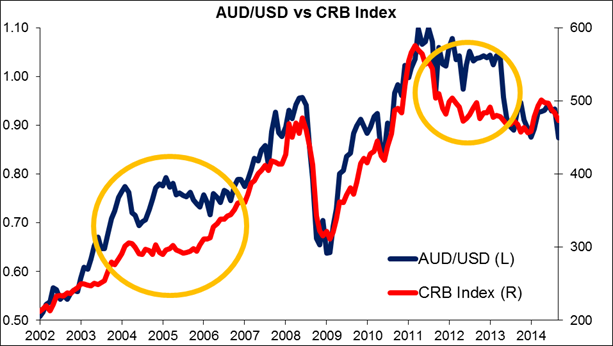
AUD rallies on China GDP Although the impact of Chinese data on AUD has been waning of late, still it can have a clear impact, as it did today. China’s Q3 GDP rose 1.9% qoq (7.3% yoy), better than expected (1.8% and 7.2%, respectively). AUD/USD went shooting up immediately in response. Industrial production was also higher than expected, while fixed asset investment and retail sales were both a bit weaker than expected and below the previous month’s figure. Still, it appears to me that China’s economy is slowing gradually, and the government’s recent operations in the money market suggest targeted help to particular sectors rather than any general loosening of monetary conditions. The minutes from the recent Reserve Bank of Australia meeting repeated the usual phrase that the currency “remained high by historical standards – particularly given recent declines in key commodity prices.” Admittedly, AUD/USD can remain divorced from commodity prices for sustained periods, so this is not necessarily going to send the currency plunging. However I still think the trend will be for Chinese growth to slow and AUD/USD to decline with it.
Today’s indicators: There are no major indicators due to be released during the European day from either the Eurozone or the UK.
In the US, existing home sales for September are coming out. Housing starts and building permits rose in September, indicating that the housing sector is growing again after a soft summer. The forecast of an increase in existing home sales suggests that the US economy is on a strong track. If the forecast is met this could strengthen USD.
The Market
EUR/USD rebounds
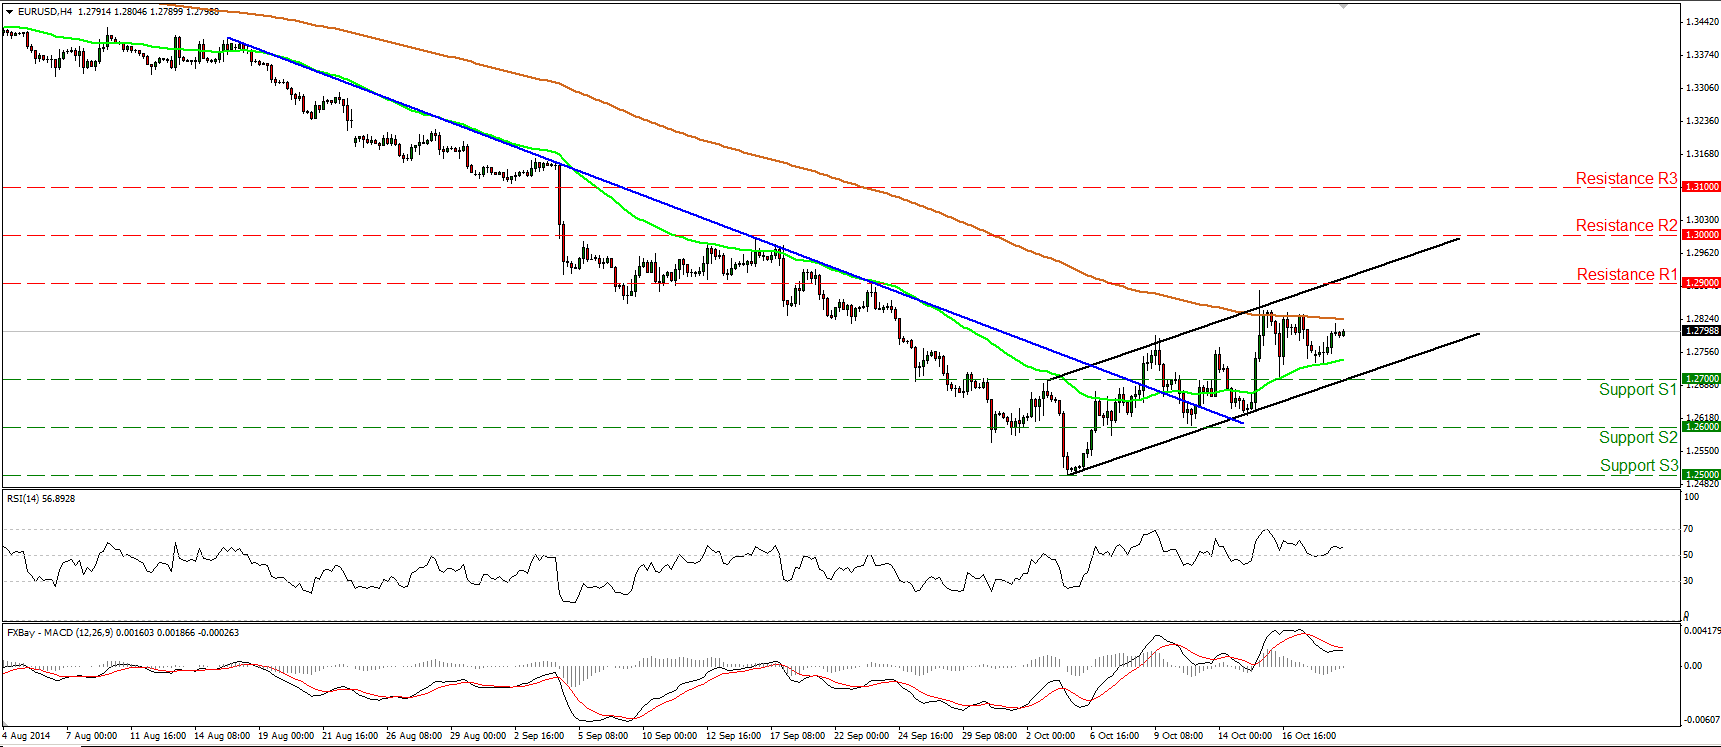
EUR/USD rebounded from near the 50-period moving average on Monday. However, the pair remained capped by the 200-period moving average. Seeing that the rate remains within the upside black channel and above the prior blue downtrend line, I still see the likelihood that the recovery from 1.2500 (S3) may extend higher. Hence, I would consider the short-term bias to remain cautiously positive. But only a clear break above the 1.2900 (R1) hurdle could trigger a strong leg up, in my view, perhaps towards the psychological line of 1.3000 (R2). As for the bigger picture, on the daily chart the price structure still suggests a downtrend, thus I retain the view that the near-term advances are a corrective phase of the longer-term down path.
• Support: 1.2700 (S1), 1.2600 (S2), 1.2500 (S3)
• Resistance: 1.2900 (R1), 1.3000 (R2), 1.3100 (R3)
GBP/JPY hits the 38.2% retracement level
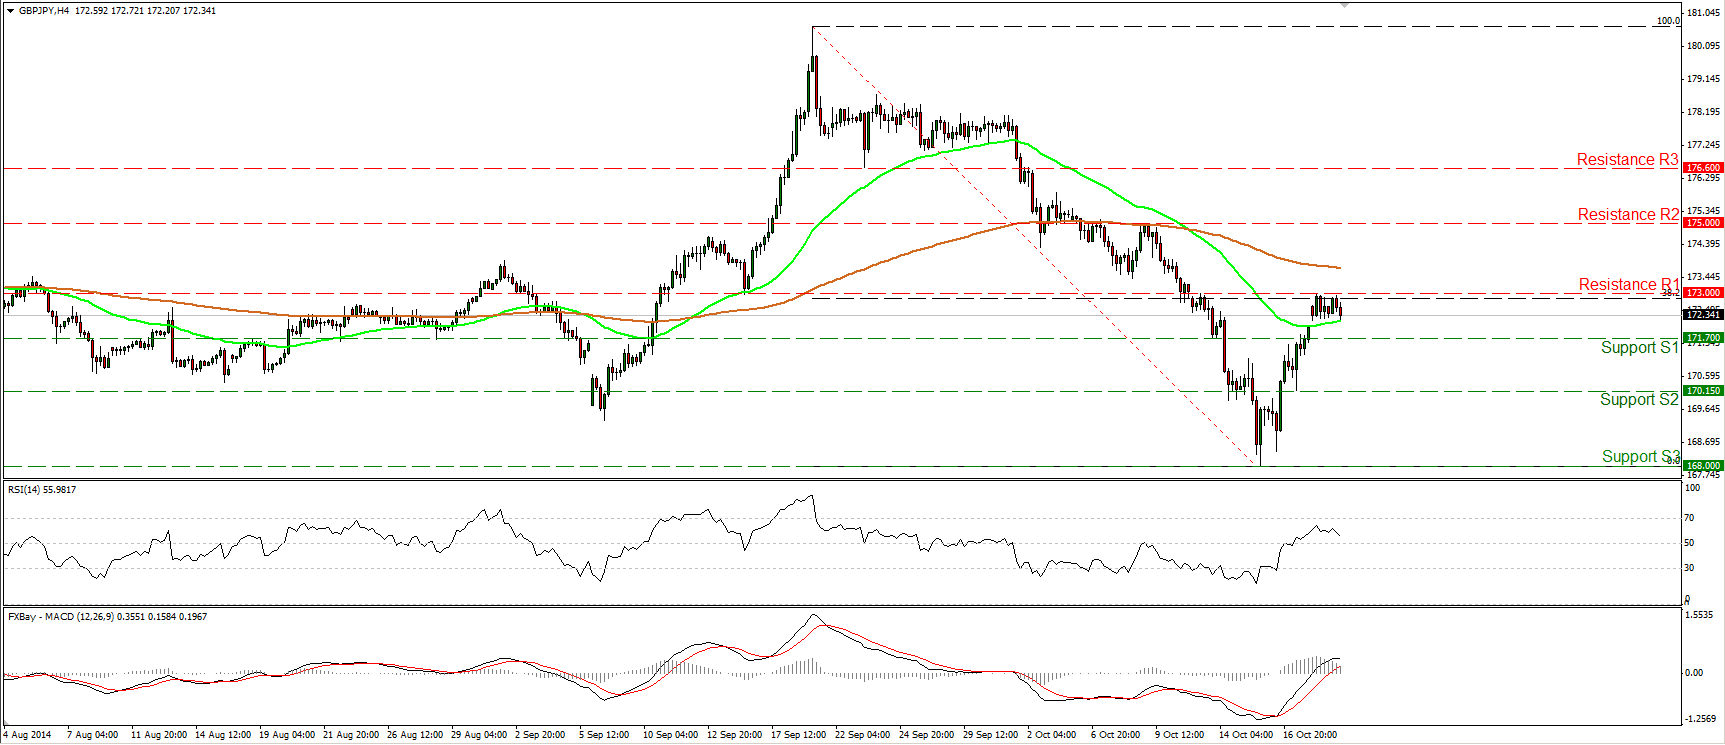
GBP/JPY moved in a consolidative mode remaining capped by the key resistance of 173.00 (R1), which lies fractionally above the 38.2% retracement level of the 19th of September – 15th of October down move. A clear dip below the 171.70 (S1) line is likely to confirm that the 15th - 20th of October up leg was just a 38.2% correction and that the bias is turned back to the downside. Such a move could probably to target the 170.15 (S2) support first. The technical oscillators both point to the inability of the bulls to move above the 173.00 (R1) hurdle. The RSI turned down after finding resistance below its 70 line, while the MACD shows signs of topping and could move below its trigger in the near future.
• Support: 171.70 (S1), 170.15 (S2), 168.00 (S3)
• Resistance: 173.00 (R1), 175.00 (R2), 176.60 (R3)
AUD/USD remains within a range
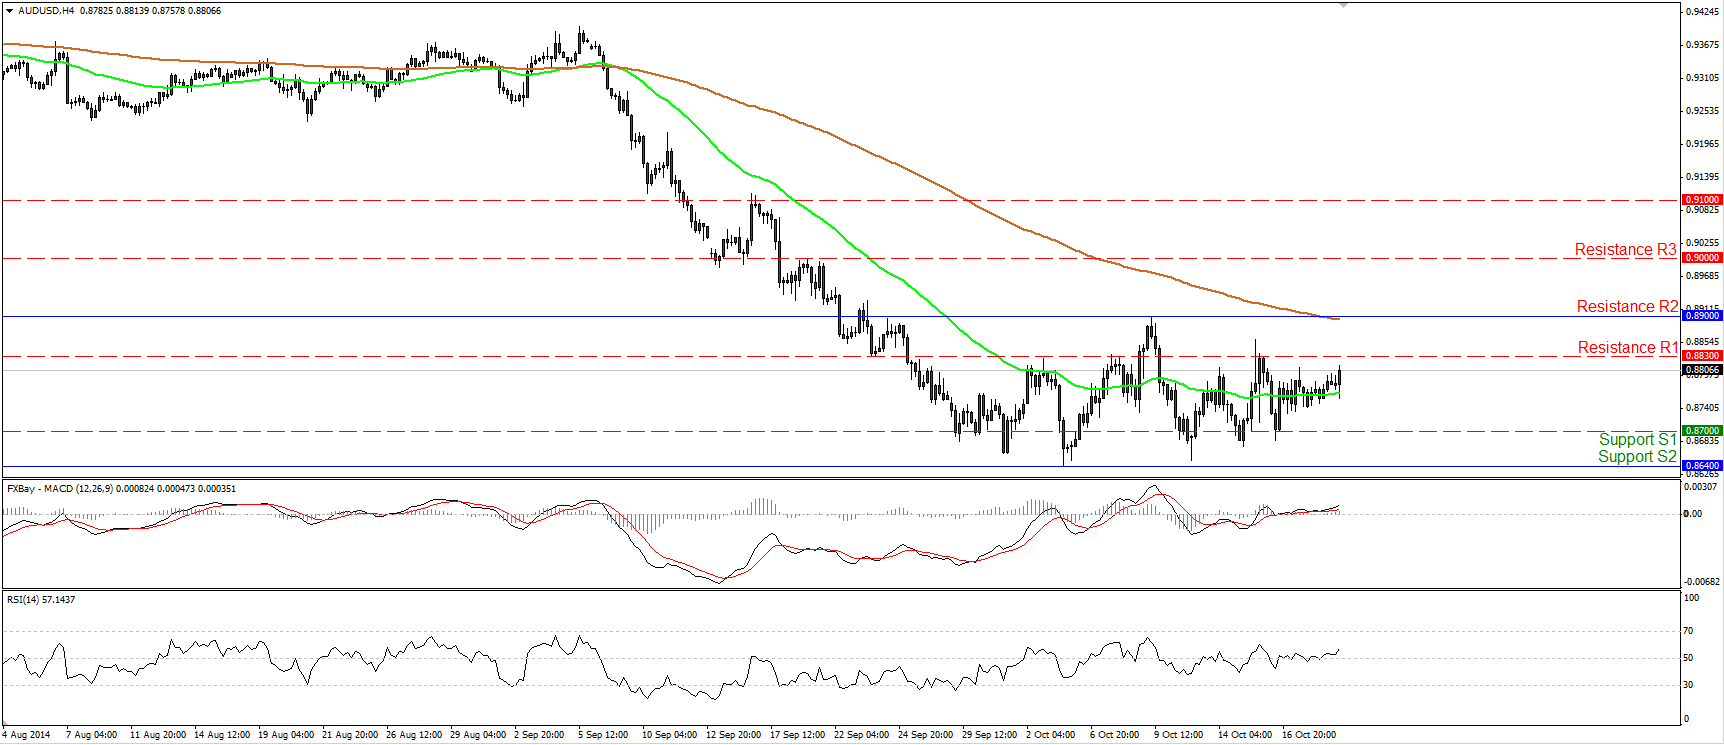
AUD/USD moved higher during the Asian morning Tuesday after China’s Q3 GDP came out better than the market consensus. Nevertheless, the rate remains within a sideways range between the 0.8640 (S2) support obstacle and the resistance of 0.8900 (R2). Our momentum studies support investors’ indecisiveness and the difficulty of choosing a direction. The MACD remains near its zero line, while the RSI lies near its 50 level. On the daily chart, although the rate remains below both the 50- and the 200-day moving averages, the 14-day RSI moved higher and is getting closer to its 50 line, while the MACD lies above its trigger and is pointing up. These momentum signs give me extra reasons to stay flat and wait for the pair to exit the sideways path.
• Support: 0.8700 (S1), 0.8640 (S2), 0.8565 (S3)
• Resistance: 0.8830 (R1), 0.89000 (R2), 0.9000 (R3)
Gold rebounds from near 1235
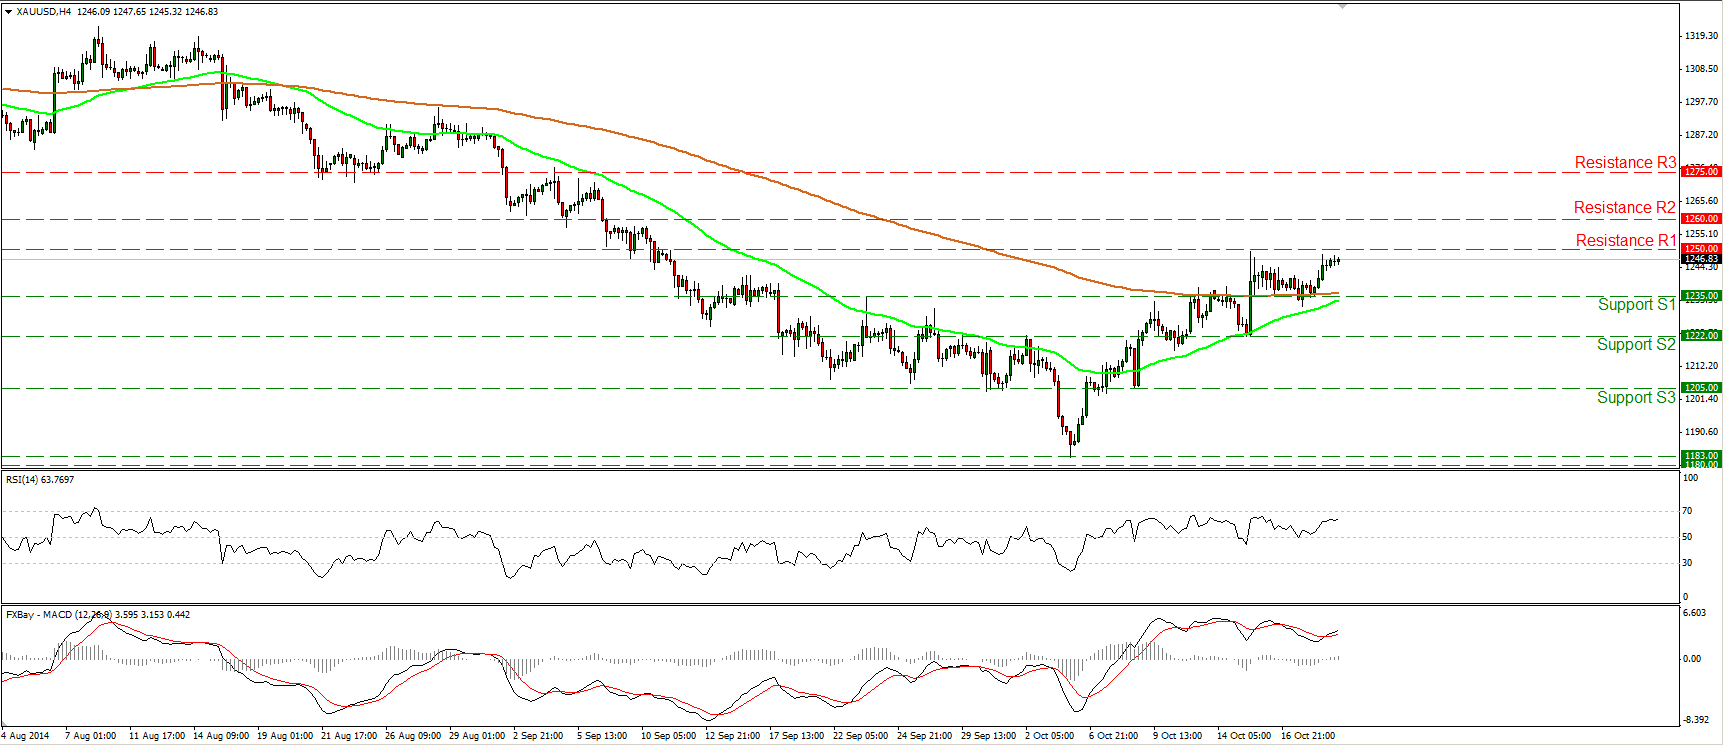
Gold rebounded from near the 1235 (S1) line yesterday, which coincides with the 200-period moving average. During the early European morning the precious metal is trading slightly below the resistance barrier of 1250 (R1), where a clear break could see scope for extensions towards the next obstacle of 1260 (R2). Taking a look at our short-term momentum studies, I see that the RSI rebounded from its 50 line and moved higher, while the MACD, already positive moved above its signal line. This indicates bullish momentum and amplifies the case for further bullish extensions in the close future. Our daily oscillators corroborate the positive near-term picture. The 14-day RSI remains above 50 and is moving higher, while the daily MACD, already above its trigger, turned positive.
• Support: 1235 (S1), 1222 (S2), 1205 (S3)
• Resistance: 1250 (R1), 1260 (R2), 1275 (R3)
WTI stays within its recent range
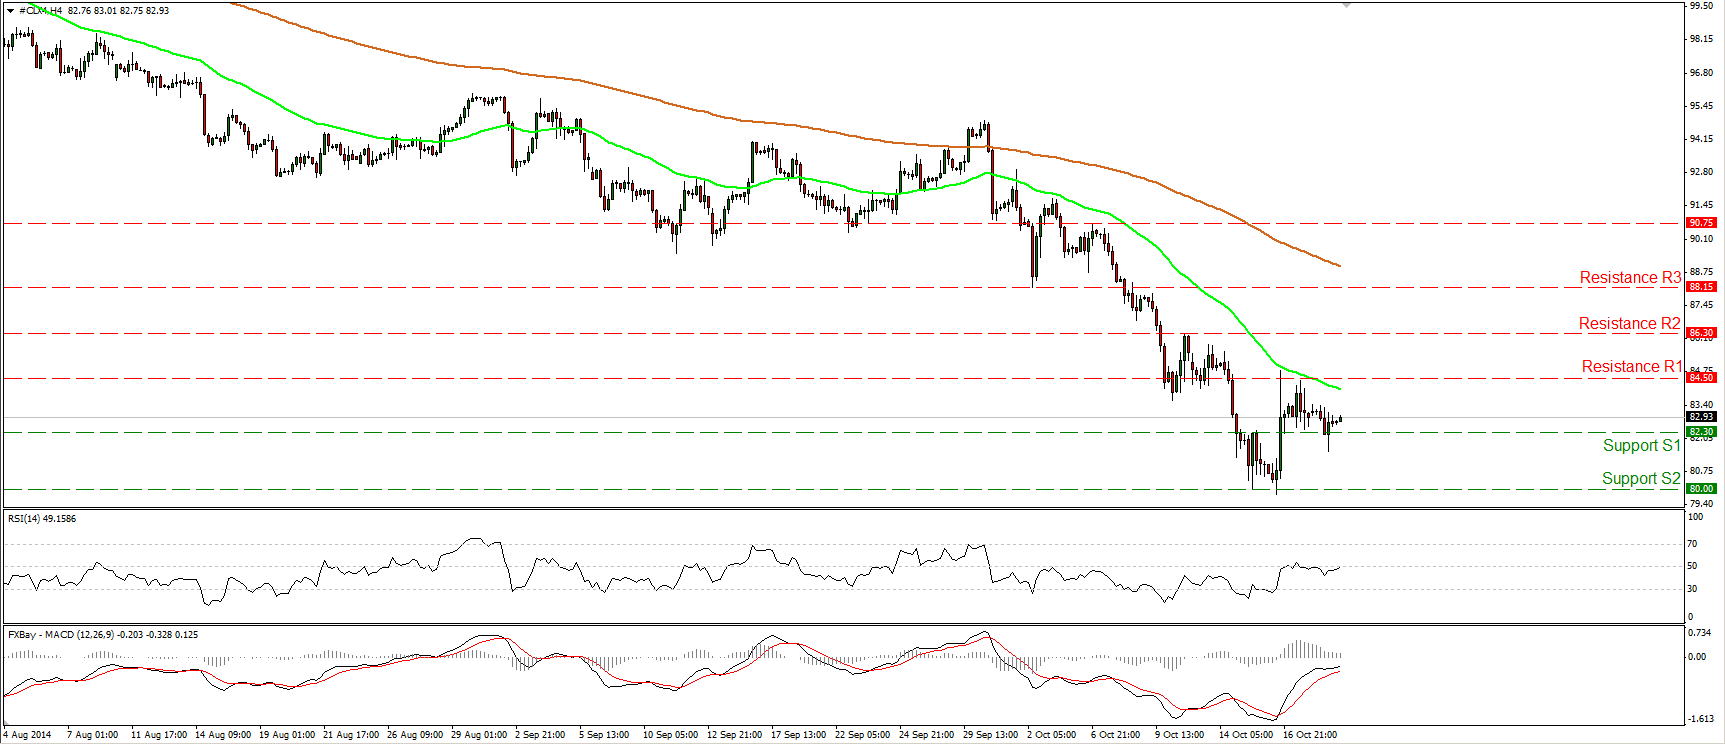
WTI moved slightly lower, but after waking some buyers below the 82.30 (S1) line, it rebounded somewhat. I see the possibility for a higher low near that area, but the price remains within the range between the 82.30 (S1) barrier and the resistance of 84.50 (R1). A move above the latter hurdle is likely to confirm a forthcoming higher high on the 4-hour chart and flip the short-term picture positive. Such a move could probably see scope for extensions towards the next resistance at 86.30 (R2). However the price structure on the daily chart still suggests a downtrend, thus I would treat any future advances as a corrective phase, at least for now.
• Support: 82.30 (S1), 80.00 (S2), 77.50 (S3)
• Resistance: 84.50 (R1), 86.30 (R2), 88.15 (R3)

