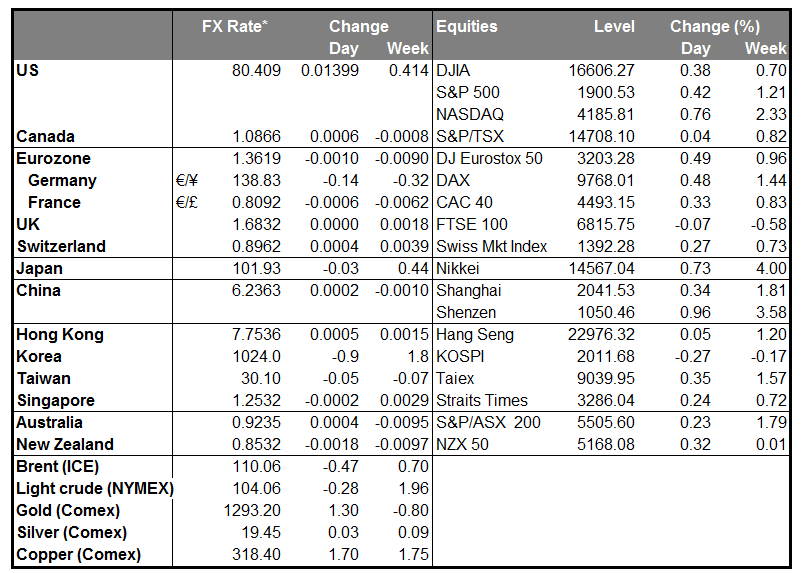
The dollar was higher against most of the other G10 currencies during the early European morning, Monday. It was lower only against CAD and virtually unchanged against AUD. The losers were SEK, NZD, NOK, EUR, GBP, CHFand JPY in that order.
The focus during the weekend was on the European Parliament elections and the presidential elections in Ukraine. Protest parties made significant gains across the European Union, with the anti-EU wave hitting hardest in France, Greece and the UK. This stretches the anti-European mood across the economic divide opened up by the sovereign debt crisis. Voters in Greece gave the first place to Syriza, the party which argues that the bailouts weren’t generous enough, while in France, the anti-euro National Front took the first place with more than 25% of the vote. In the UK, the winner was UKIP, the Independence Party which wants to pull Britain out of the European Union. Parliament leaders will meet on the morning of May 27 to discuss the election results and the Commission presidency.
In Ukraine, the leading candidate, Petro Poroshenko, was elected as president, receiving more than 50% of yesterday’s vote and as a result no second round will be needed in a few weeks. In a fragile situation, early clarity helps. One of the main issues Poroshenko will have to deal with will be to ease tensions in the East, where the separatists’ revolution continues to be a major destabilizing problem. Pro-Russian rebels prevented people from voting in much of the big urban centers of the Eastern Donbass region.
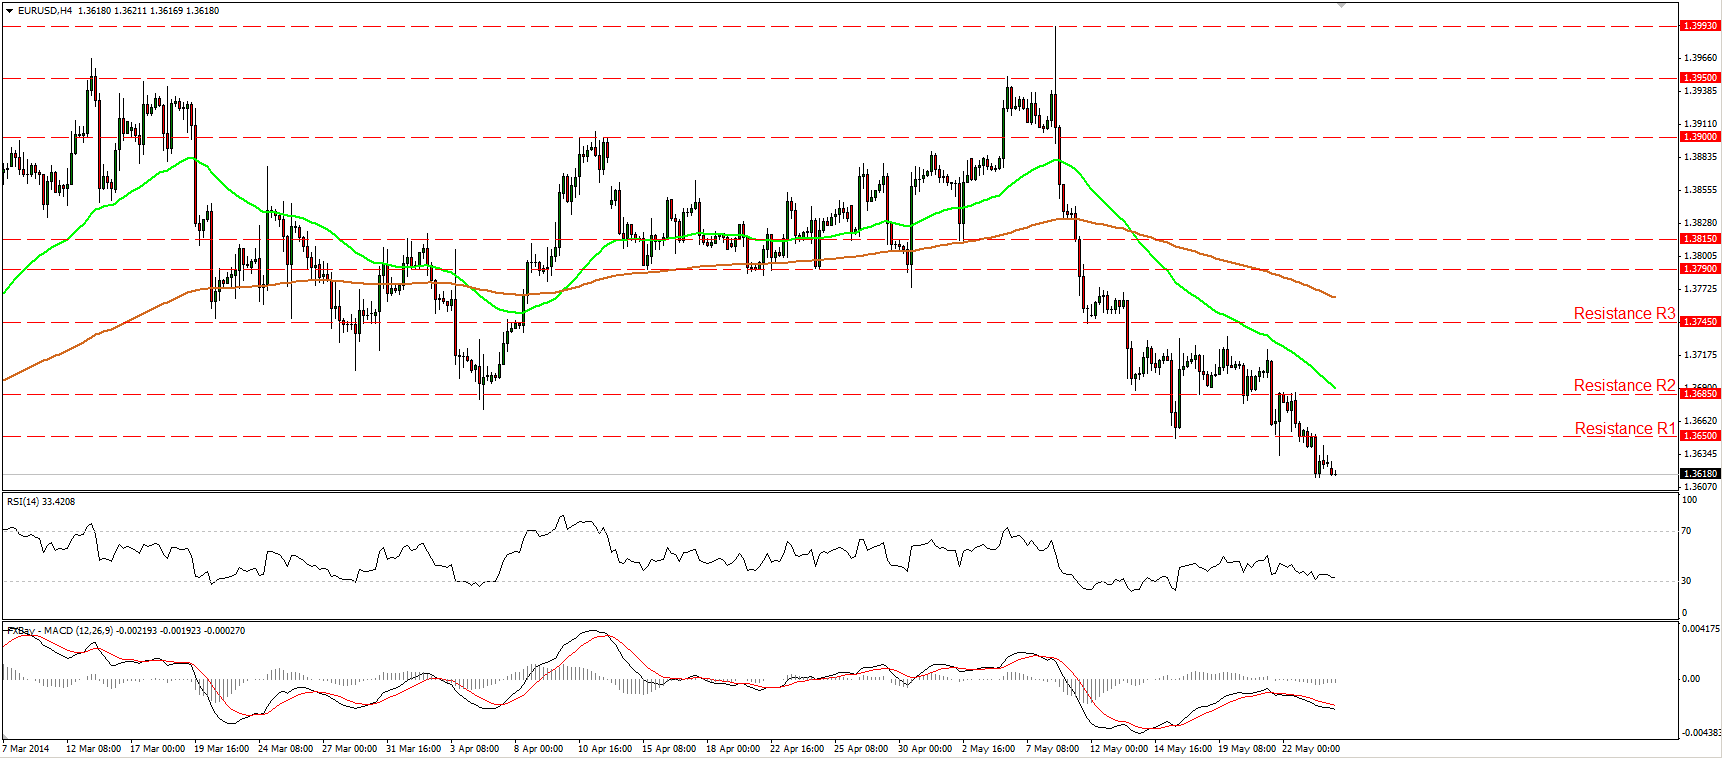
On Friday, the common currency extended its losses after the worse-than-expected German Ifo survey for May. The current assessment index declined to 114.8 from 115.3 a month earlier, missing market estimates of 115.4, while the expectations index fell to 106.2 from 107.3. The forecast for the expectations index was for a decline to 106.5. EUR/USD moved further below the 1.3650 barrier. I still expect the pair to challenge the 1.3600 zone, near the 200-day moving average. A clear dip below that support area could have larger bearish implications, targeting the lows of February at 1.3475.
The Swedish Krona was the main loser after Sweden’s confidence data for May missed market estimates, while the Canadian dollar was the main gainer after Canada’s headline inflation quickened in April to reach the Central Bank’s 2% target for the first time in two years. Nonetheless, I still expect the loonie to weaken in the longer run. At its latest meeting the Bank of Canada said that a weakening local currency would support the nation’s exports. Bank of Canada Gov. Poloz also said he will dismiss faster inflation this year as temporary, because of slack in the economy.
Today, the calendar is relatively light as it is a public holiday in the UK and the US. We only get PPI and retail sales data from Sweden, both for April. Sweden’s PPI is forecast to have accelerated to +1.8% year-over-year (yoy) from +1.0% yoy in March, while retail sales are expected to have declined 0.5% mom, after rising 1.1% mom the previous month.
We have one speaker scheduled on Monday: Bank of Japan Deputy Governor Iwata.
As for the rest of the week, on Tuesday, the UK BBA mortgage approvals for April are coming out, while in the US, we have durable goods orders for the same month. The Federal Housing Finance Agency (FHFA) and the S&P/Case-Shiller housing price indices for March are also due out. On Wednesday, the German unemployment rate for May and Eurozone’s M3 money supply for April are to be released. On Thursday, in the US, we get the second estimate of GDP for Q1 and pending home sales for April. On Friday, during the Asian morning, we have the usual end-of-month data dump from Japan and New Zealand’s building permits for April. As for the European day, Sweden’s GDP for Q1 and Italy’s preliminary CPI for May are coming out. In the US, we have personal income and personal spending for April, alongside the University of Michigan final consumer sentiment for May. We also get Canada’s GDP data for Q1.
The Market
EUR/USD is getting closer to 1.3600
EUR/USD declined on Friday after the German Ifo survey for May missed estimates. The pair moved further below the 1.3650 (R1) barrier and I would still expect the bears to target the support zone of 1.3600 (S1). Both the RSI and the MACD moved lower, with the latter one lying below both its zero and signal lines, confirming the bearish momentum of the price action. In the bigger picture, the 1.3600 (S1) zone coincides with the 200-day moving average, thus, a decisive dip below that zone could have larger bearish implications targeting the lows of February at 1.3475 (S2).
• Support: 1.3600 (S1), 1.3475 (S2), 1.3400 (S3).
• Resistance: 1.3650 (R1), 1.3685 (R2), 1.3745 (R3).
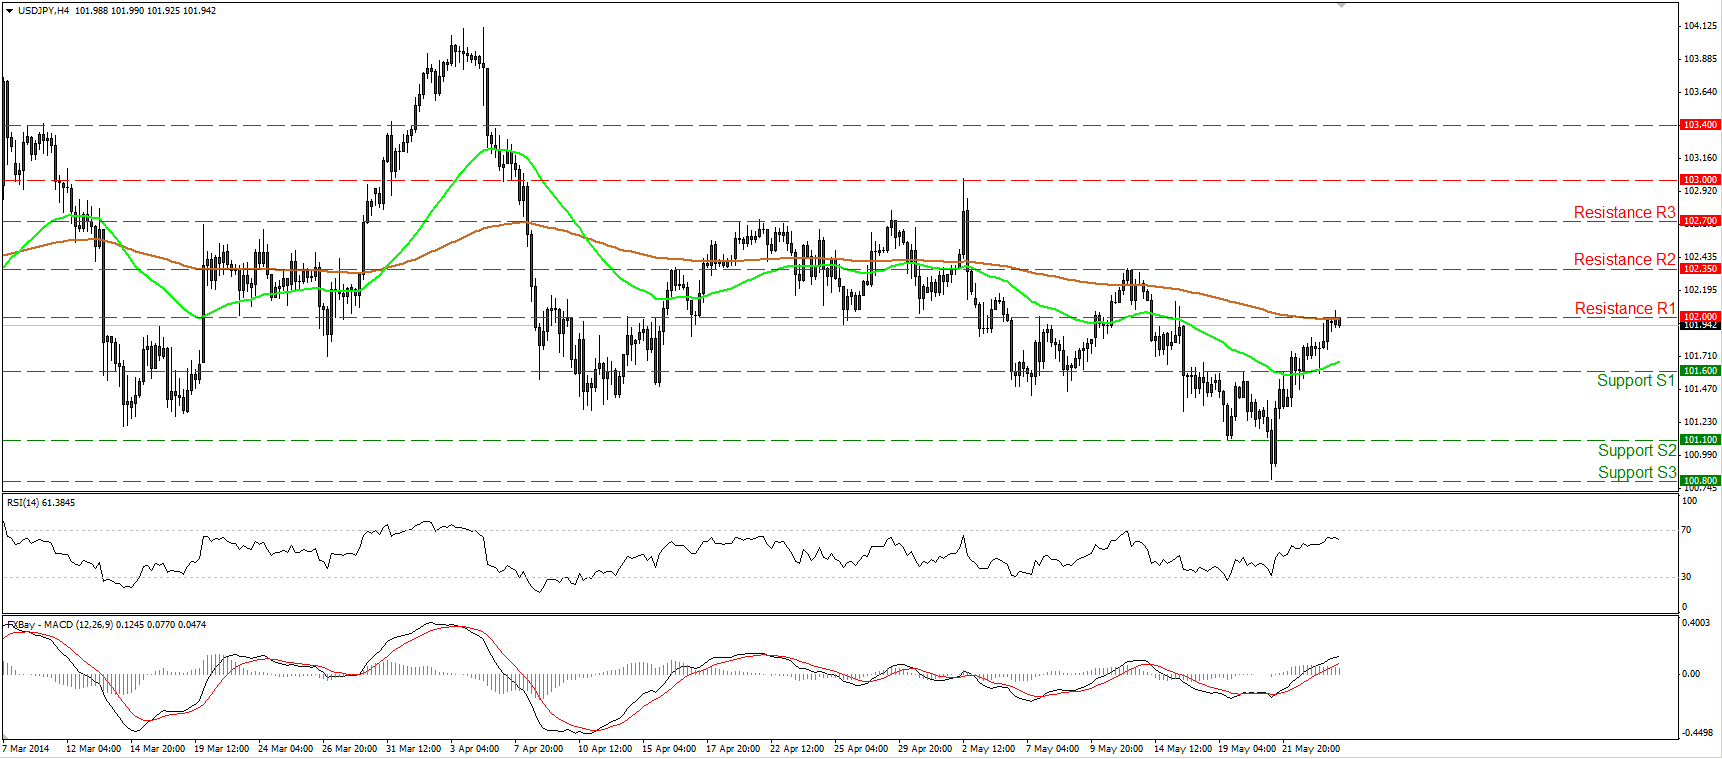
USD/JPY touches 102.00
USD/JPY moved above the 101.60 hurdle and reached the resistance of 102.00 (R1) and the 200-period moving average. Considering that on the 1-hour chart, we have negative divergence between our hourly momentum studies and the price action, I would not rule out a forthcoming bearish wave, maybe to test the 101.60 (S1) bar as a support this time. In the bigger picture, the long-term path of USD/JPY remains to the sideways, since we cannot identify a clear trending structure.
• Support: 101.60 (S1), 101.10 (S2), 100.80 (S3).
• Resistance: 102.00 (R1), 102.35 (R2), 102.70 (R3).
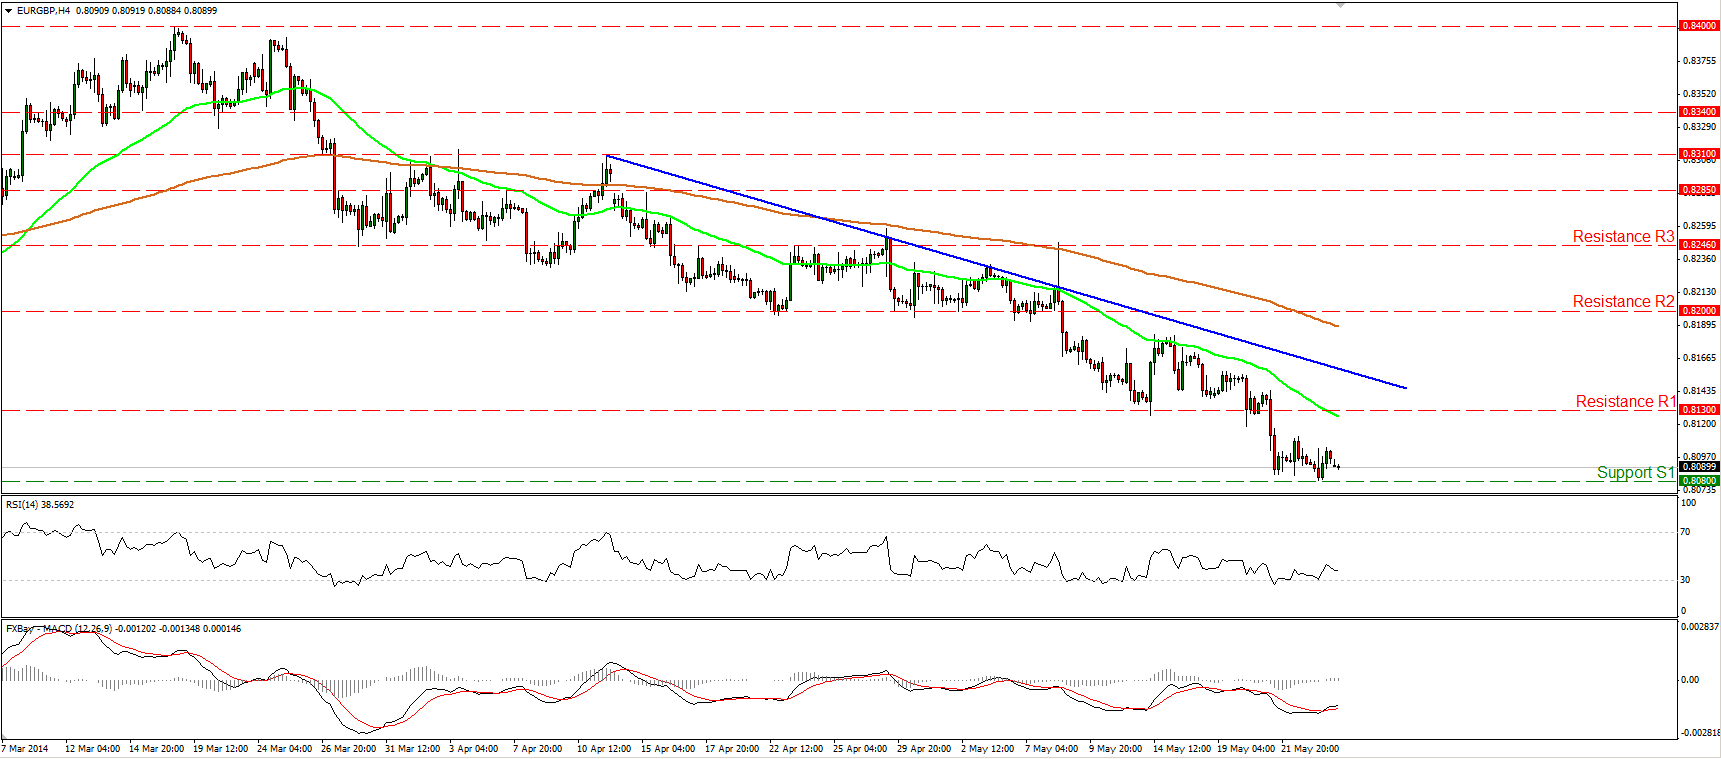
EUR/GBP finds support at 0.8080
EUR/GBP declined to find support at the 0.8080 (S1) barrier. If the bears are strong enough to push the rate below that barrier, I would expect them to target the next support at 0.8035 (S2). As long as the rate is printing lower highs and lower lows below both the moving averages and below the blue downtrend line, I see a negative picture. The RSI met support at its 30 level and moved higher, while the MACD, although in its bearish territory, crossed above its signal line, thus an upside corrective wave cannot be ruled out.
• Support: 0.8080 (S1), 0.8035 (S2), 0.8000 (S3).
• Resistance: 0.8130 (R1), 0.8200 (R2), 0.8246 (R3).
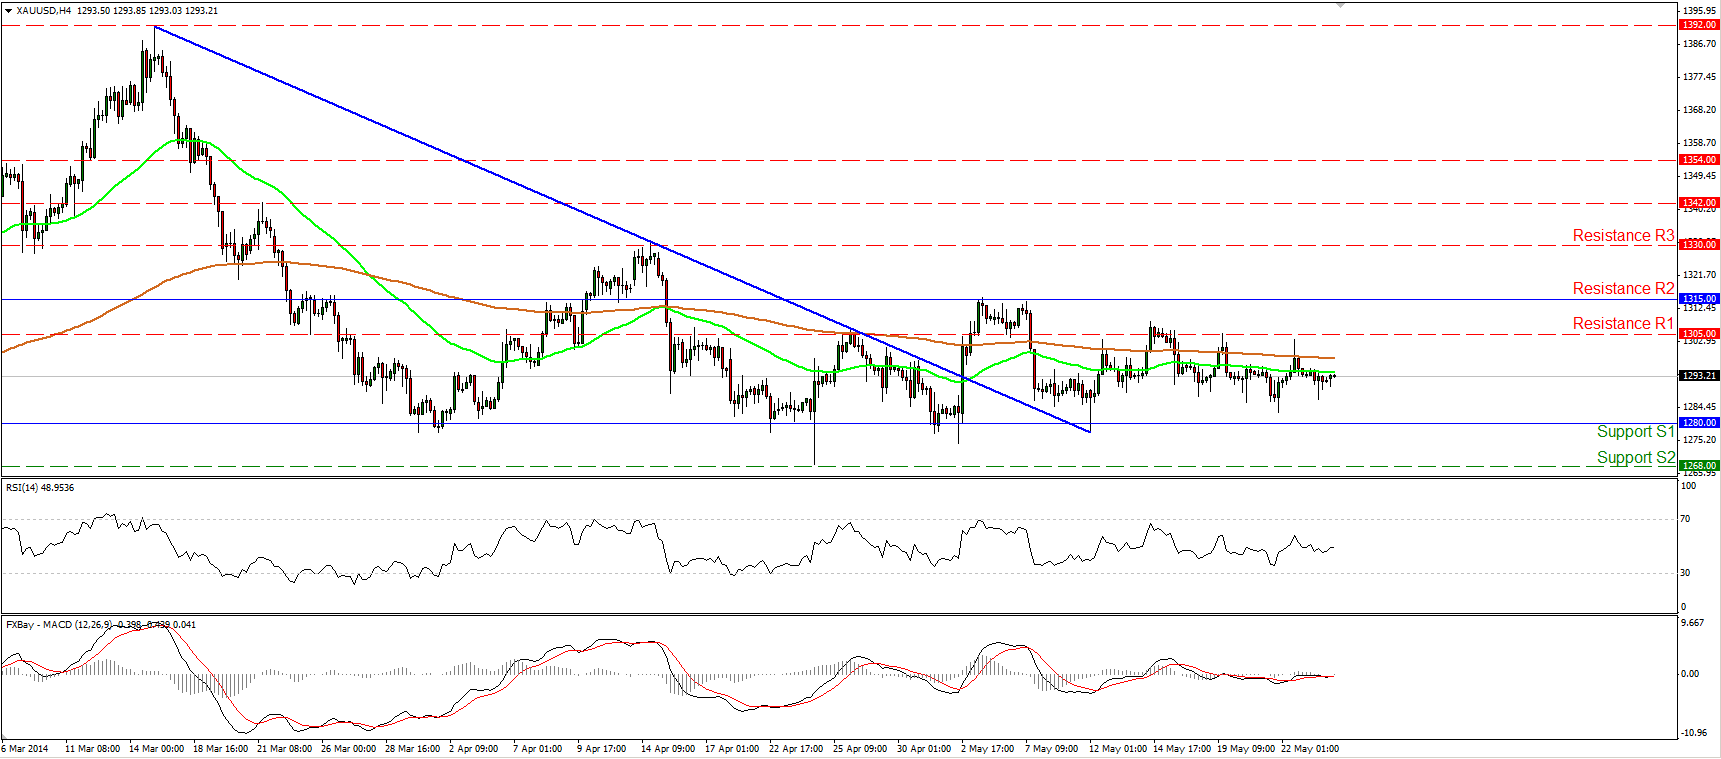
Gold continues sideways
Gold continued its consolidative mode on Friday, remaining within the sideways path between the support of 1280 (S1) and the resistance of 1315 (R2). Both our moving averages continue to point sideways, while both the daily MACD and the daily RSI lie near their neutral levels, confirming the trendless picture of the yellow metal. A break above 1315 (R2) is needed to turn the picture positive and could target the resistance of 1330 (R3), while a dip below 1280 (S1) may see the support of 1268 (S2).
• Support: 1280 (S1), 1268 (S2), 1250 (S3).
• Resistance: 1305 (R1), 1315 (R2), 1330 (R3).
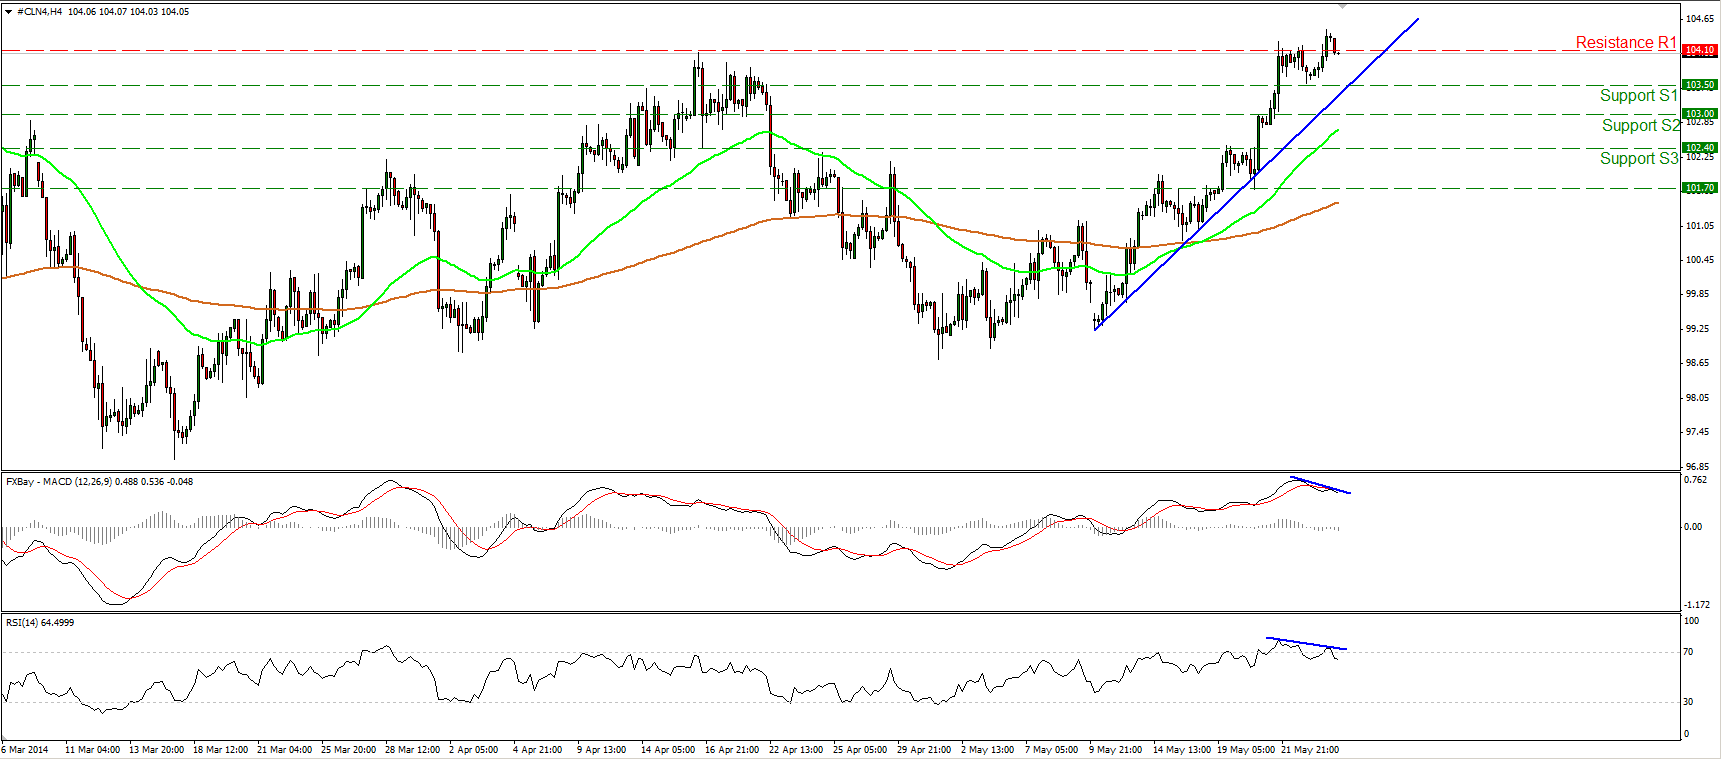
WTI’s uptrend is losing momentum
WTI broke the 104.10 barrier, but failed to maintain its price above that level and declined to trade once again below it. As long as WTI is printing higher highs and higher lows above both the moving averages and above the blue trend line, the uptrend remains in effect. However, I would adopt a neutral stance for now, since we can identify negative divergence between both our momentum studies and the price action, indicating that the trend is running out of momentum.
• Support: 103.50 (S1), 103.00 (S2), 102.40 (S3).
• Resistance: 104.10 (R1), 105.00 (R2), 108.00 (R3).

