Greek election – more thoughts Sunday’s election in Greece was an event that will have repercussions for the eurozone for several months. Indeed, given the impact that it may have on other countries’ elections, it could be the defining event for Europe in 2015. Note the strong relationship between SYRIZA and Spain’s Podemos Party, as demonstrated by the presence of the leader of Podemos, Pablo Iglesias, on the podium with SYRIZA’s Alexis Tsipras yesterday (see photo). SYRIZA’s victory may boost Podemos’ popularity in Spain, which is a much bigger issue for the eurozone than Greece is because of the general election in Spain this fall.
Clashes coming The EUR recovered somewhat yesterday, probably on a “sell the rumor, buy the fact” response as the SYRIZA victory was expected. Moreover, Tsipras has been consistently moving to the center as the election approached, and his party’s coalition with the relatively conservative Independent Greeks further reassures investors. Nonetheless, I believe there are more shocks in store for the FX market from the election. The Greek press reports that the new government already has legislation ready to send to Parliament reversing some of the structural reforms implemented in the Troika program. I’m not sure how well that will sit with Greece’s creditors. The legislation could disrupt Greece’s exit from its five-year bailout program, which expires at the end of February, and leave the country’s banks without a liquidity backstop. Greek banks rely on the ECB for funding, but the ECB has warned it will stop providing liquidity unless Greece reaches a new agreement with its creditors.
Debt relief has dominated the headlines, but that really isn’t the main issue. As the FT pointed out yesterday, the maturities are already quite long (average of 16.5 years, double that of Italy or Germany) and Europe may be willing to extend them even further. Rather, the two main points are the fiscal outlook and structural reforms. On the former issue, the government is supposed to be running a substantial surplus before interest payments, but tax collection has plummeted ahead of the election and it is now running a large deficit again. The first question is whether the government will be willing to raise taxes enough to meet its budget targets, or Brussels will be willing to lower the targets. On structural reform, much depends on what legislation is introduced and how Brussels reacts. So far, the indications are that the two sides are very far apart.
Best case: The EU softens its targets for Greece and extends debt maturities further. In return, the new Greek government commits to further structural reforms. It’s difficult to reconcile this with SYRIZA’s platform, however. They could do it and blame it on the need to keep the Independent Greeks in the coalition. EUR would probably stabilize temporarily, but QE keep it under pressure.
Worst case: No agreement. The various participants argue until July/August, when EUR 6.7bn in bonds mature, and then Greece defaults. Greece either has capital controls imposed or leaves the eurozone. Disaster for EUR.
Middle case: No agreement reached, but default averted somehow. This might need to involve either a new election or at least a change in the coalition members. Even this scenario involves considerable risk for EUR. EUR continues on declining trend as increased tension plus QE pressure the currency.
CHF weakens after the Greek election went as expected or even better, meaning there was less need for safe havens. It may recover in coming weeks however if tensions there mount.
RUB collapsed after Standard & Poor’s cut Russia’s rating below that of Moody’s and Fitch, who were already at the lowest investment grade, and left Russia on negative watch. The rising tensions in Ukraine and talk of additional sanctions didn’t help, either.
Today’s highlights: The 1st estimate of UK Q4 GDP is expected to show an acceleration in the pace of growth from Q3. Given the weak industrial production data in October and November, we wouldn’t be surprised with a below-consensus growth rate. Along with the falling inflation rate, a disappointment in the growth figure could keep the markets convinced that the first rate hike won’t be until after the general election in May. This is likely to keep GBP/USD under pressure.
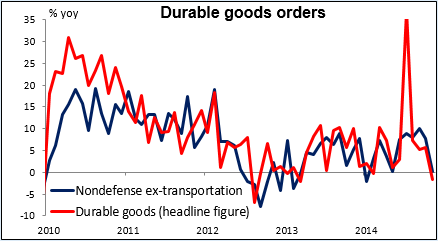
In the US, we get durable goods for December. The headline figure and durable goods excluding transportation equipment, are both estimated to rebound from the previous month. S&P/Case-Shiller house price index for November is expected to have decelerated from October. The Richmond Fed manufacturing index, the Conference Board consumer index and the preliminary Markit service-sector PMI all for January are also to be released. These are likely to keep confidence up and the USD supported.
We have no speakers on Tuesday’s agenda.
Looking ahead to tomorrow’s FOMC meeting: There are two countervailing trends that the Federal Open Market Committee (FOMC) will have to deal with. On the one hand, domestic factors are improving faster than expected. On the other hand, overseas factors are going in the opposite direction quickly. Which should they focus on? In my experience, the Fed generally puts priority on the domestic economy and so I do not expect any change in the language this month.
Domestically, the labor market has improved faster than expected. The unemployment rate of 5.6% is almost within the range of what the Fed considers to be “full employment,” which is 5.2%-5.5%. The main thing preventing them from raising rates immediately is inflation. Both wage and price inflation are well below their target, and especially wage inflation has barely budged despite significantly less slack in the labor market. Low inflation will allow the Fed to remain “patient” despite employment approaching its target level. Some economists believe however that wage inflation is just in the early stages of moving up in response to labor market tightening. If the Committee agrees, then it should prove no obstacle to a tightening mid-year.
However outside the US, the trend of policy is definitely in the opposite direction. Canada, Denmark, and the eurozone have all loosened policy in the last couple of weeks in response to the growing deflationary threat. Nonetheless, I think the Fed’s response is likely to be different. While certainly some states are likely to be hurt by the fall in oil prices, as may some banks, overall lower oil prices are beneficial for the US economy and so will be seen to be a boost, perhaps even an inflationary boost (while energy prices decline, prices of other goods may increase as demand increases). Moreover, at the last FOMC meeting, “although the projected path of the dollar was revised up, the staff revised down its estimate of how much the appreciation of the dollar since last summer would restrain projected growth in real GDP.” So the Committee has already discussed the stronger dollar resulting from divergent monetary policy and concluded that it is not a major worry for the US economy.
As a result, I still believe the FOMC is targeting a mid-year hike in rates. The Committee is likely to ignore the slow rise of wages as long as survey measures of wage intentions, such as the National Federation of Independent Businesses, continue to show a rising trend and payroll employment continues to rise 200k a month. Hence I do not expect any substantial change in the FOMC’s language this week.
The Market
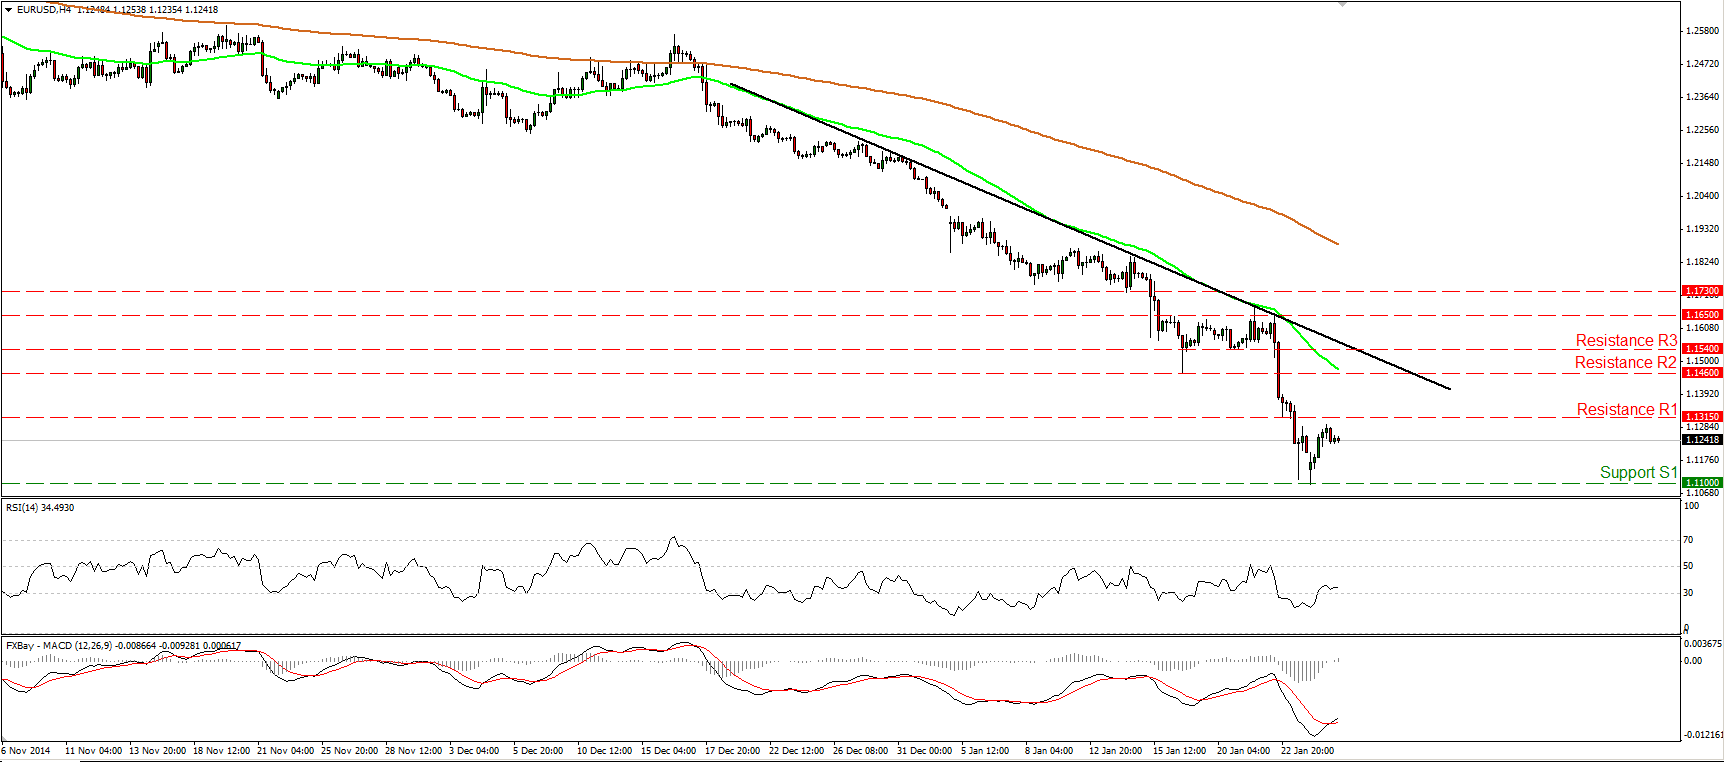
EUR/USD slightly below the resistance of 1.1315
EUR/USD edged higher yesterday and is currently trading slightly below our resistance hurdle of 1.1315 (R1). Our short-term momentum studies suggest that the rebound may continue for a while. A break above the 1.1350 (R1) obstacle is likely to prompt extensions towards the 1.1460 line, defined by the low of the 16th of January. Nonetheless, since the rate is trading below the black downtrend line, the short-term path remains negative in my view and I would treat yesterday’s rebound, or any extensions of it, as a corrective move before the next leg down. The broader trend is to the downside too. The pair is printing higher peaks and higher troughs below both the 50- and the 200- day moving averages. Therefore, I would expect sellers to eventually take control in the not-too-distant future and drive the battle below 1.1100 (S1). Such a move could see scope for extensions towards the next support zone of 1.1025 (S2), the inside swing defined by the high of the 1st of September 2003.
• Support: 1.1100 (S1), 1.1025 (S2), 1.1000 (S3)
• Resistance: 1.1315 (R1), 1.1460 (R2), 1.1540 (R3)
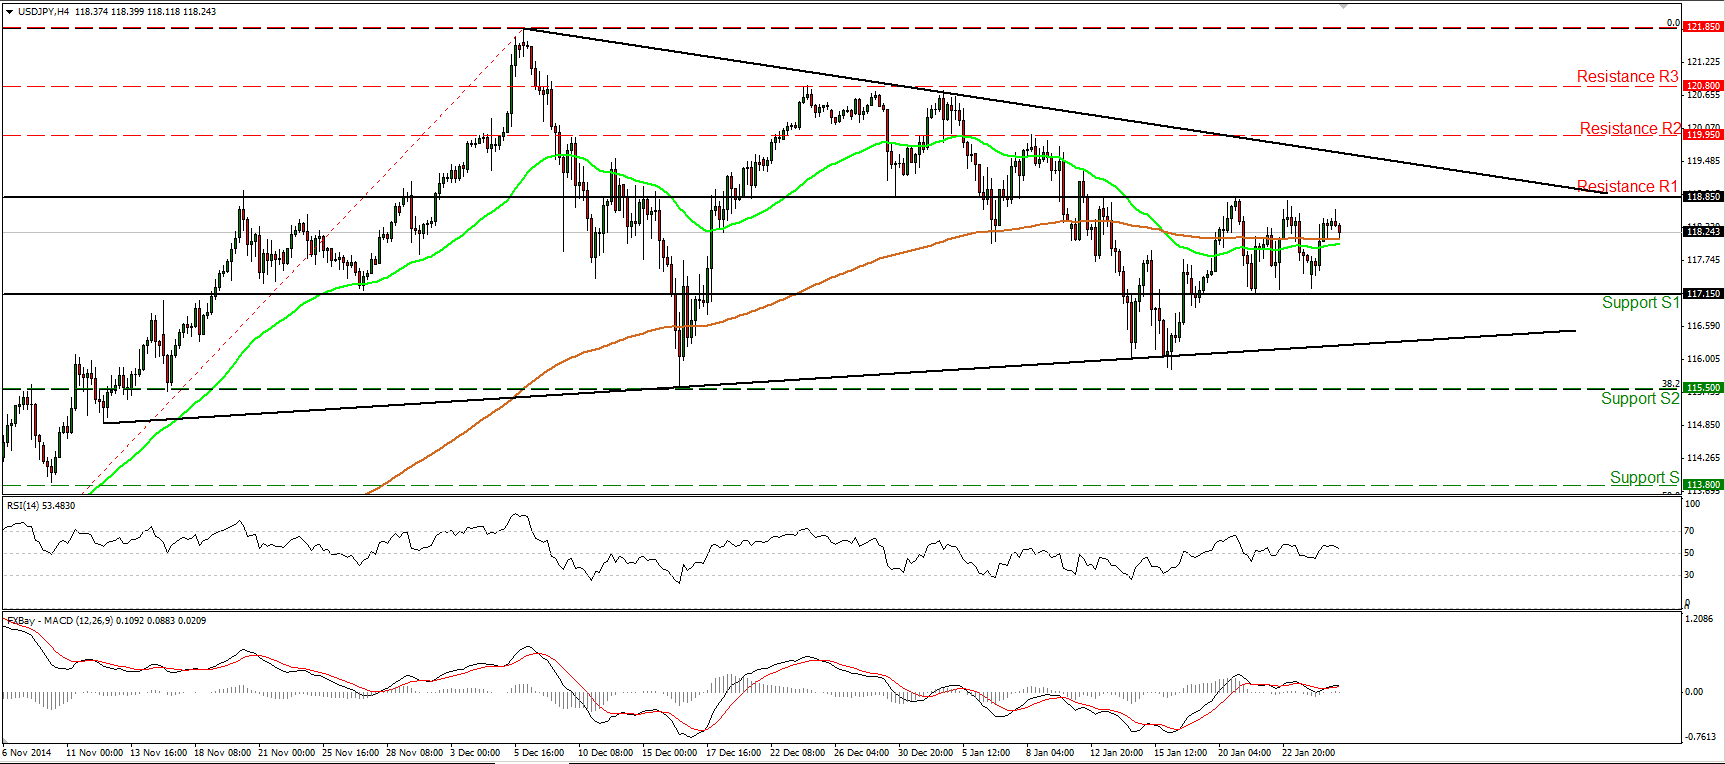
USD/JPY in a short-term sideways mode
USD/JPY rebounded after finding support fractionally above the 117.15 (S1) line, but the advance was halted slightly below the resistance hurdle of 118.85 (R1). The rate has been oscillating between these two barriers since the 19th of the month and hence I would expect the forthcoming wave to be to the downside, perhaps for another test at the 117.15 support zone. On the daily chart, the rate is still trading above both the 50- and the 200-day moving averages, but it’s been also trading within a possible triangle formation. As a result, I would wait for an escape out of the pattern before making any assumptions about the continuation or end of the longer-term uptrend.
• Support: 117.15 (S1), 115.50 (S2), 113.80 (S3)
• Resistance: 118.85 (R1), 119.95 (R2), 120.80 (R3)
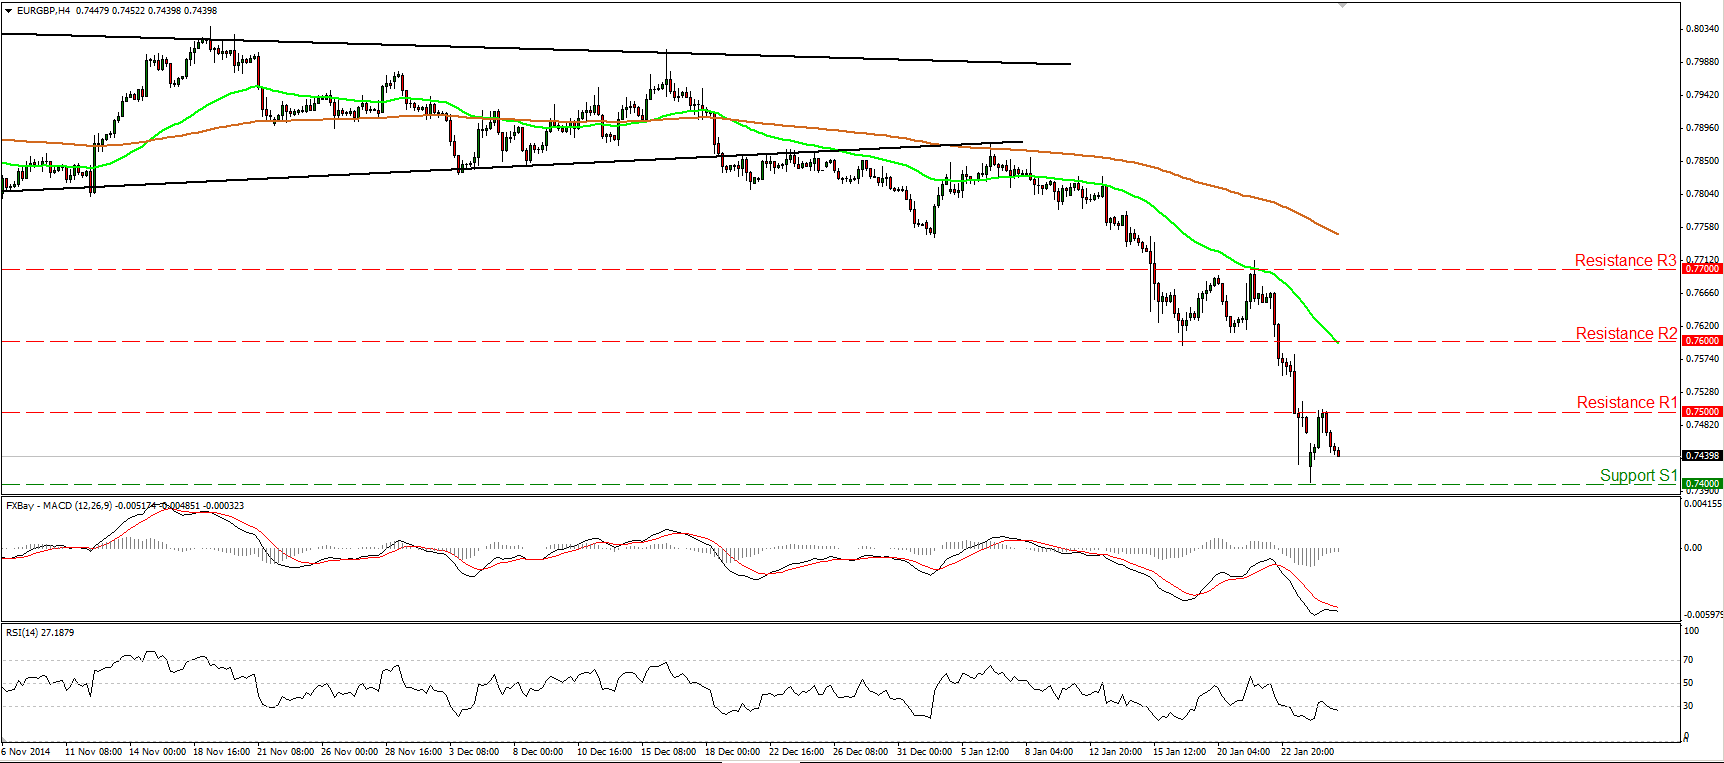
EUR/GBP hits resistance at 0.7500
EUR/GBP hit resistance near the psychological line of 0.7500 (R1) and retreated thereafter. I would now expect another test near the 0.7400 (S1) zone. If sellers are strong enough to overcome that support zone we may experience extensions towards the 0.7320 (S2) barrier, determined by the low of the 31st of December 2007. The accelerating downside momentum is visible on our daily oscillators as well. The 14-day RSI is back within its oversold territory pointing down, while the daily MACD fell deeper within its negative field. As for the bigger picture, the downside exit of the triangle pattern on the 18th of December signaled the continuation of the longer-term downtrend, thus the overall outlook stays negative in my view.
• Support: 0.7400 (S1), 0.7320 (S2), 0.7230 (S3)
• Resistance: 0.7500 (R1), 0.7600 (R2), 0.7700 (R3)
Gold corrects lower
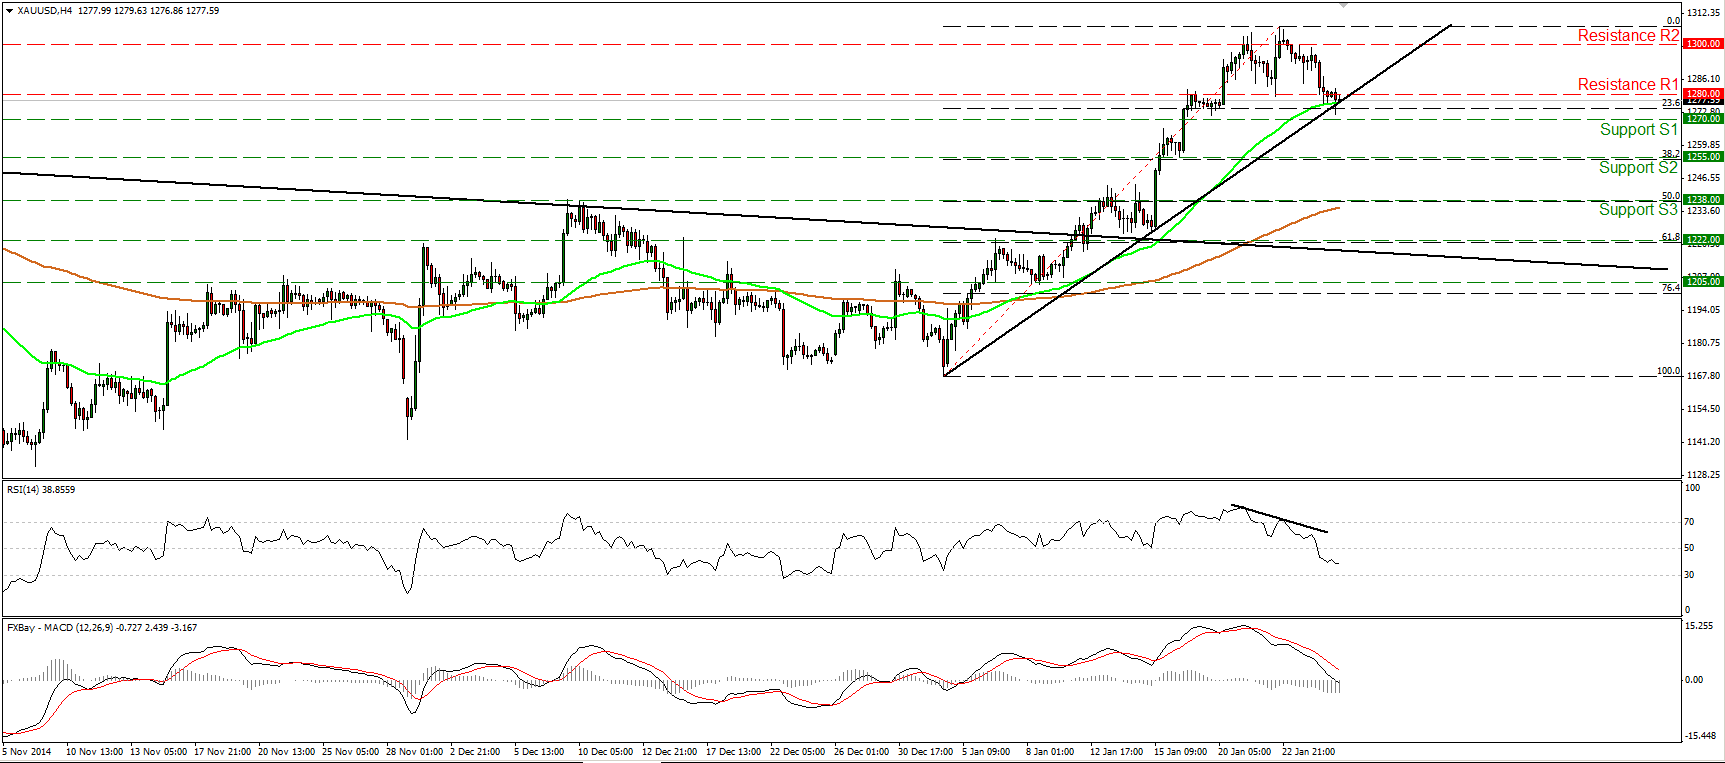
Gold continued pulling back on Monday, to fall below 1280 (R1) and to trade near the black uptrend line taken from back at the low of the 2nd of January. Given our momentum signs I would expect the corrective phase to continue, perhaps even to below 1270 (S1). The RSI fell below its 50 line and is now pointing down, while the MACD, already below its signal line, just touched its toe below its zero line. A move below 1270 (S1), could challenge the 1255 (S2) line, which lies fractionally close to the 38.2% retracement level of the 2nd – 22nd of January up leg. Our daily momentum studies corroborate my view as well. The 14-day RSI exited its overbought territory and the daily MACD shows signs of topping. On the daily chart, since I don’t see major bearish trend reversal signals and since the possibility for a forthcoming higher low still exists, I would see a mildly positive medium term picture and I would treat any possible future declines as a corrective phase for now.
• Support: 1270 (S1), 1255 (S2), 1238 (S3)
• Resistance: 1280 (R1), 1300 (R2), 1320 (R3)
WTI hits support at 45.00
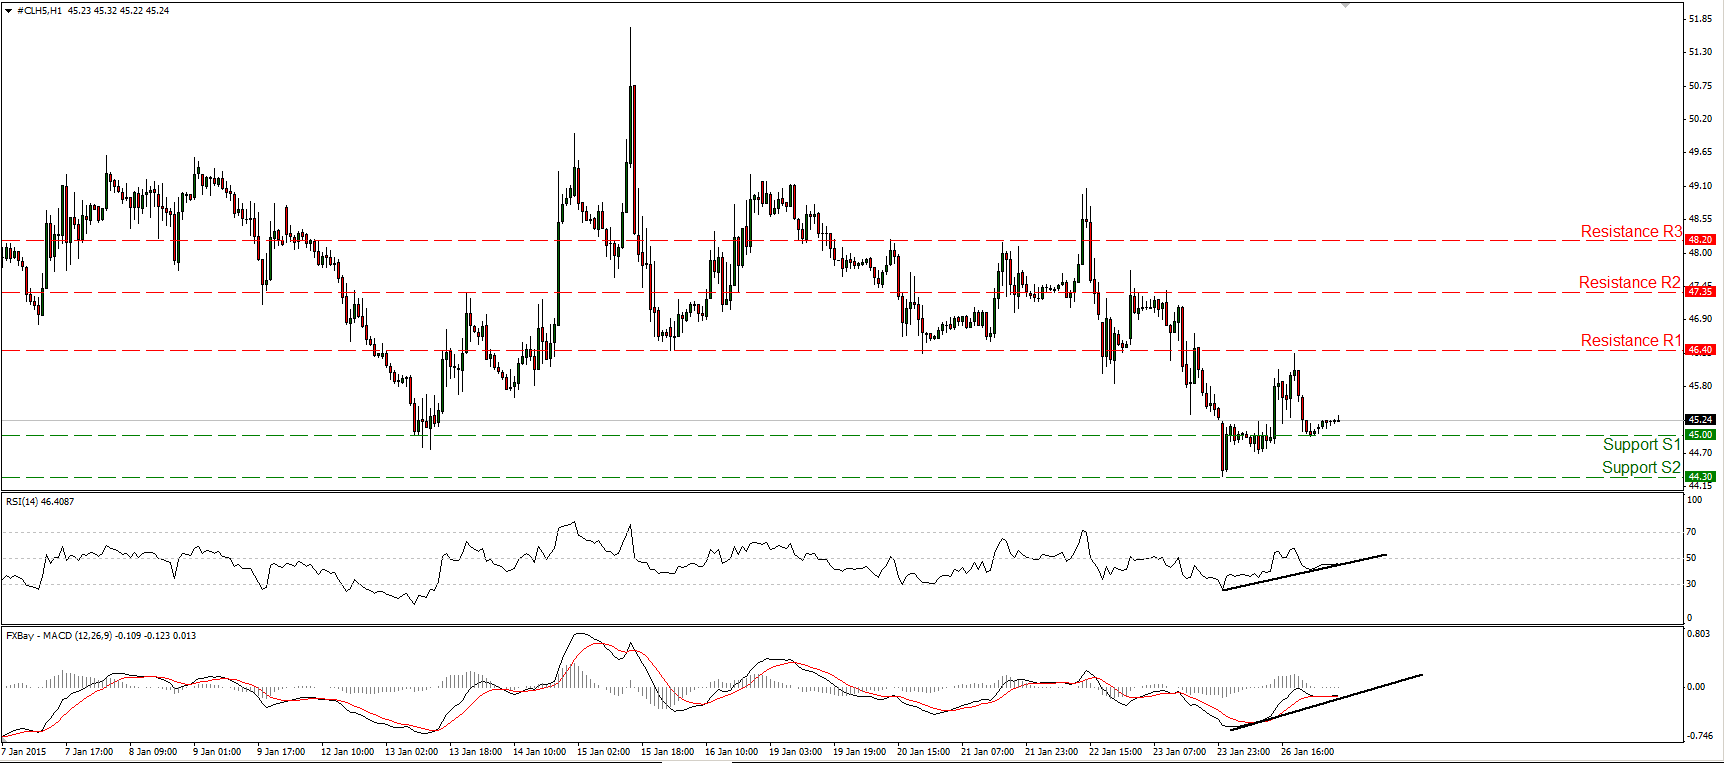
WTI rebounded strongly on Monday, hit resistance at 46.40 (R1) and pulled down to find support near the 45.00 (S1) line. Our momentum studies are still in a rising mode, thus an up leg and another test near 46.40 (R1) are possible. On the daily chart, WTI is still printing lower peaks and lower troughs below both the 50- and the 200-day moving averages, and this keeps the overall downtrend intact. However, since there is still positive divergence between the daily oscillators and the price action, I would prefer to wait for the momentum indicators to confirm the price action before getting confident again about the overall down path.
• Support: 45.00 (S1), 44.30 (S2), 42.50 (S3)
• Resistance: 46.40 (R1), 47.35 (R2), 48.20 (R3)

