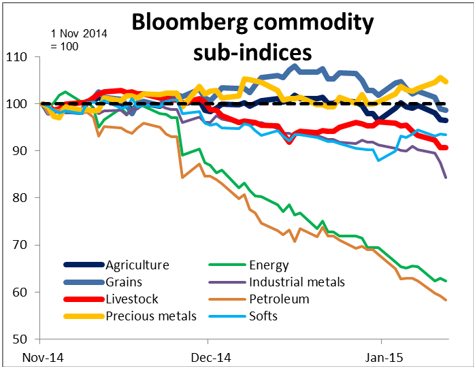
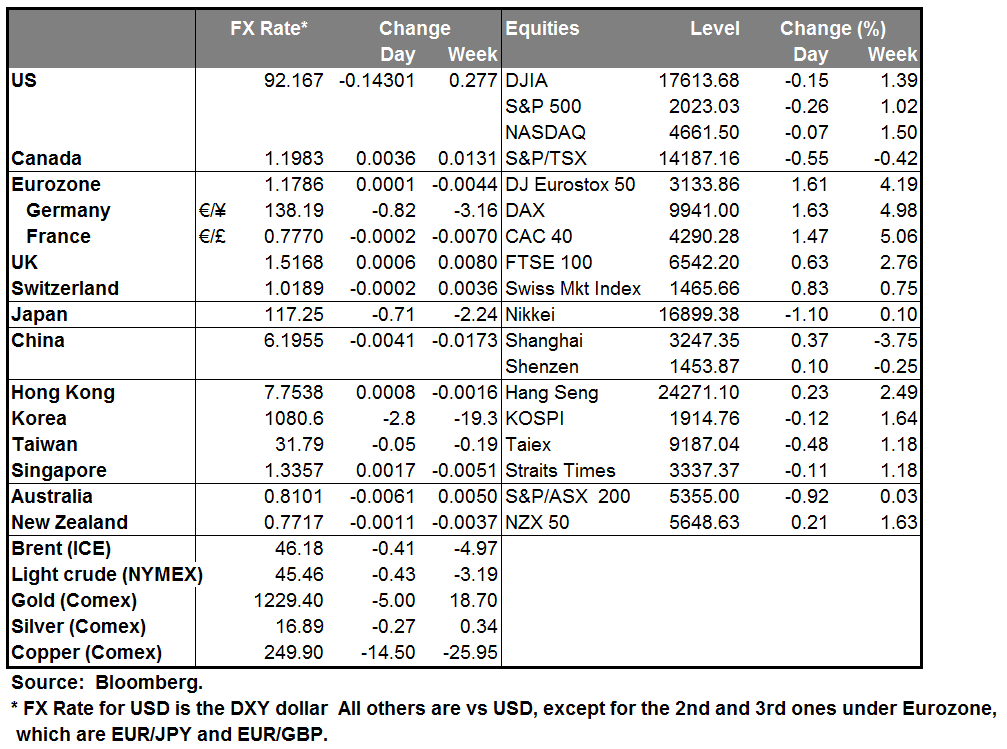
It’s getting to be a familiar pattern: commodity prices fall, Fed Funds rate expectations fall and yet the dollar rises. Copper was down almost 8% yesterday while corn futures fell some 4% -- more important than you might think, as corn is used in a surprising range of products (and foods through fructose and livestock feed of course but also plastics, pharmaceuticals, paper and over 4,000 other products). WTI actually bounced a little bit but Brent was lower as the UAE oil minister said that OPEC would stand firm on its decision to keep output unchanged. In this context of falling commodity prices, Fed Funds rate expectations retreated another 5 bps in the long end.
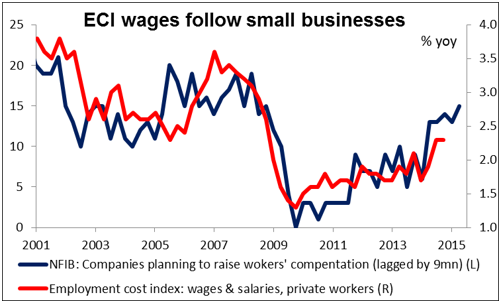
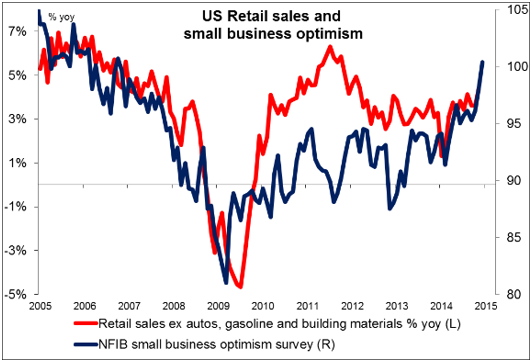
The news on jobs however was favorable, which raises the likelihood of the Fed tightening on schedule. Contrary to the disappointing average weekly earnings figures, the National Federation of Independent Businesses (NFIB) survey employment diffusion index rose by 4 points to the highest level since August 2007. The worker compensation DI also rose by 4 points to the highest level since Jan. 2008. These indices have a good correlation with the employment cost index (ECI), which makes sense as most Americans work in small businesses. Thus yesterday’s news corroborates what I said about the average earnings possibly being an aberration. The Job Offers and Labor Turnover Survey (JOLTS) job openings were up 0.1 ppt. The hiring rate fell 0.1 ppt but remains up 0.3 ppt from a year ago, while the quits rate was unchanged. These figures are consistent with an ECI of around 2.6%, which is relatively healthy and should not prevent the Fed from raising rates, in my view. Thus I see them as USD-positive.
The mood on CAD is turning bearish as USD/CAD approaches 1.20. Bank of Canada Deputy Gov. Timothy Land gave a dovish speech in which he said “Lower oil prices are also typically accompanied by a weaker Canadian dollar, and this time is no exception” and “…lower oil prices are likely, on the whole, to be bad for Canada.” He said BoC would watch closely for the impact of falling oil prices on growth “and the delay it may cause to the economy’s return to its production potential.” So falling oil prices will not only depress CAD through terms of trade but also through monetary policy. That means it’s doubly bad for CAD and the currency is likely to weaken further.
JPY was the only currency gaining vs USD although it’s hard to see why besides the usual correlation between USD/JPY and Tokyo stocks as the Nikkei was down 1.1%. On the other hand, there’s talk in the market that the Bank of Japan may cut its core CPI forecast for the fiscal year beginning in April to 1.5% or lower, with the Nikkei newspaper suggesting they may cut it to the lower half of the 1% range in their statement following the Jan. 21st meeting because of falling oil prices. This would be a big blow as the coming FY was the deadline for the BoJ to hit its 2% inflation target. That could mean even more QE! With that possibility in mind, I expect that the current bout of JPY strength to be only temporary.
Today’s highlights: During the European time, the European Court of Justice is expected to give a non-binding opinion on the legality of the ECB’s Outright Monetary Transactions program. The OMT, introduced in 2012, is an earlier bond-purchase program created in order to allow the Bank to buy debt from distressed countries if necessary. If the court’s adviser expresses doubts about the OMT program, this could have an adverse impact on the effectiveness and the design of the broad-based ECB government bond purchases. The markets are likely to assume that this would reduce the flexibility on how the ECB may structure any QE program.
The most likely reaction to a negative result would be a “dead cat bounce” in the euro. After all, the possibility of QE is depressing the euro, so less QE should support the euro. There is a small chance though that it could cause the euro to fall even more if it makes people think that there is now no hope for the Eurozone economy and deflation is inevitable. In that case they could begin to sell their outrageously priced Eurozone bonds (Spain yielding less than Treasuries? Bund yields zero or negative out to five years?) and put the money into Treasuries. On the other hand, an opinion that supports the OMT would probably keep the common currency under selling pressure and perhaps accelerate its downtrend. The market is already pricing in the introduction of a QE program, but the structure of it will be important for the pace of euro’s decline. We believe that the most likely outcome is a compromise solution, perhaps implying a few limitations on OMT but not rejecting it. The reaction in that case is likely to be minimal and investors would stay focused on the ECB meeting next week.
As for the indicators, France CPI rate for December is expected to drop to 0% yoy, in line with the overall deflationary conditions in the Eurozone.
In the UK, Bank of England Governor Mark Carney and other MPC members testify at the Parliament’s Treasury Select Committee on the financial stability report published in December. At the press conference report, Gov. Carney stressed that the lower inflation boosts consumers spending power. He may repeat this view given the further decline in the CPI rate.
In the US, headline retail sales for December are forecast to drop, a turnaround from the previous month. However, usually the focus is on retail sales excluding auto and gasoline, which are forecast to remain unchanged. That could weaken the dollar a bit. The Fed releases the Beige book two weeks before its Jan. 27-28 policy meeting.
The Market
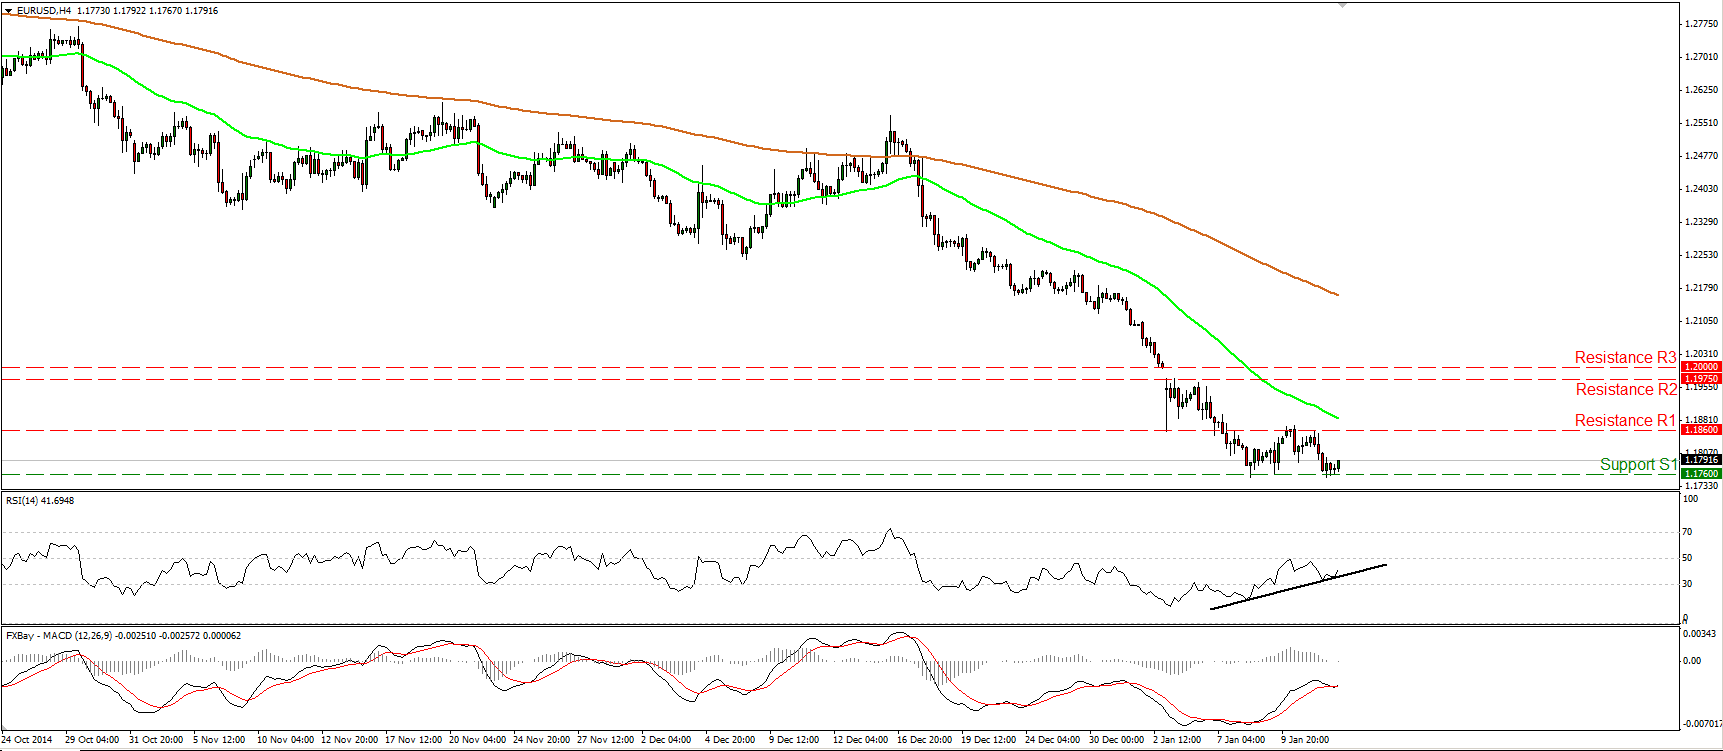
EUR/USD hits support near 1.1760
EUR/USD moved lower after touching again the resistance line of 1.1860 (R1), but the decline was halted around 1.1760 (S1). Given that there is again positive divergence between the he RSI and the price action I would stay careful of another bounce towards the 1.1860 (R1) line. Nevertheless, given that the longer-term trend is to the downside, I would treat any possible bullish waves as corrective moves and wait for more actionable signs that the bears are back in control. I still believe that we are likely to see this pair touching 1.1700 (S2) in the close future, determined by the low of the 8th of December 2005.
• Support: 1.1760 (S1), 1.1700 (S2), 1.1635 (S3)
• Resistance: 1.1860 (R1), 1.1975 (R2), 1.2000 (R3)
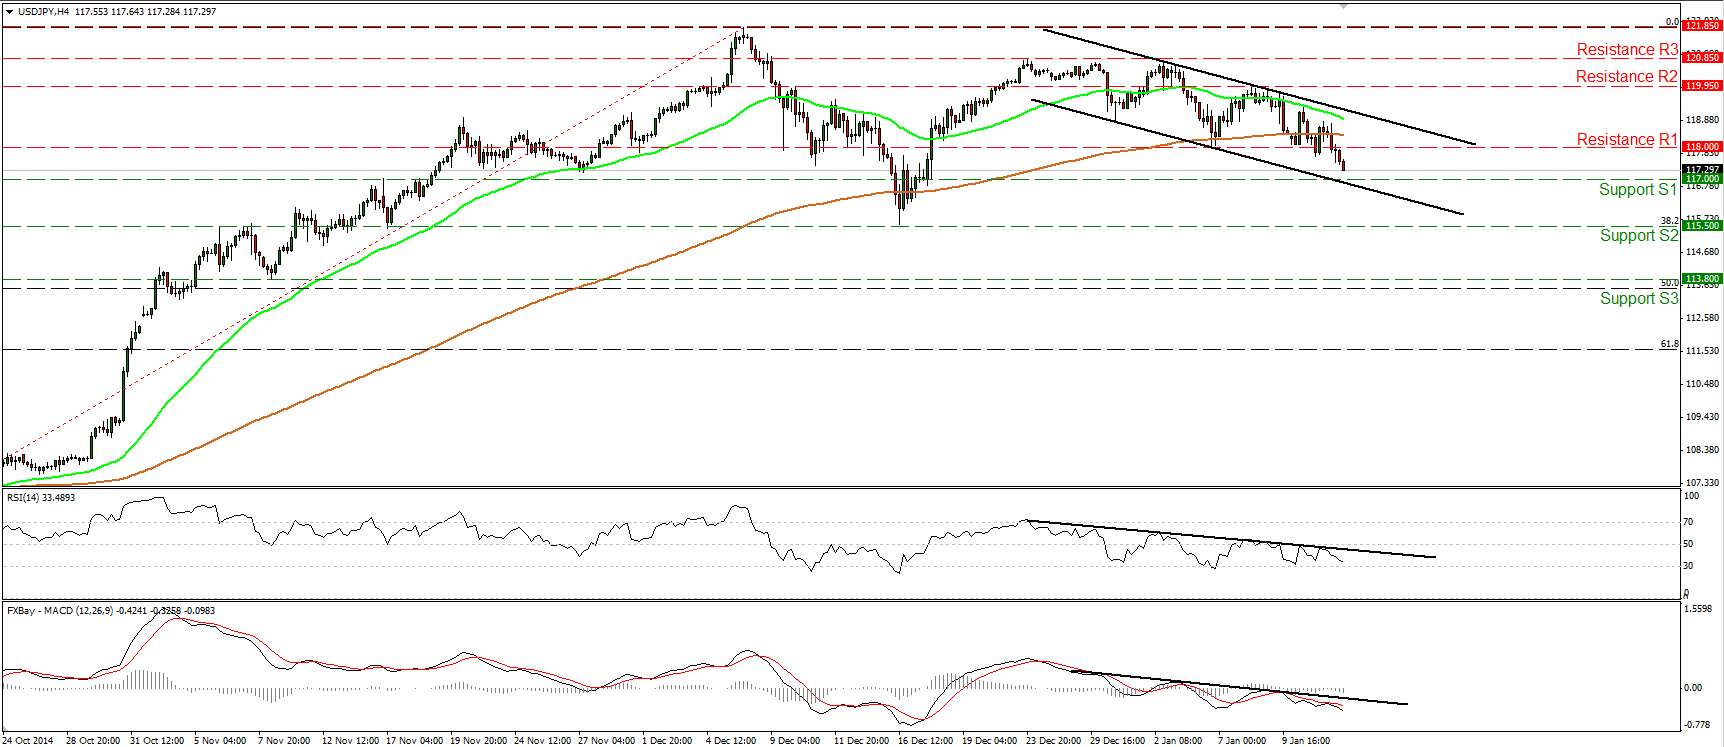
USD/JPY heading towards 117.00
USD/JPY tumbled on Tuesday, falling below the support (turned into resistance) area of 118.00 (R1). During the early European morning Wednesday, the rate is heading towards the 117.00 line and the lower bound of the black near-term downside channel. If the bears maintain their momentum and manage to drive the battle below that support territory, I would expect them to pull the trigger for the key barrier of 115.50 (S2), defined by the low of the 16th of December. This line also coincides with the 38.2% retracement level of the 15th of October – 8th of December up wave. Our momentum studies complete the negative near-term picture of USD/JPY. The RSI hit resistance near its 50 line and moved lower, while the MACD stands below both its zero and signal lines, pointing south.
• Support: 117.00 (S1), 115.50 (S2), 113.80 (S3)
• Resistance: 118.00 (R1), 119.95 (R2), 120.85 (R3)
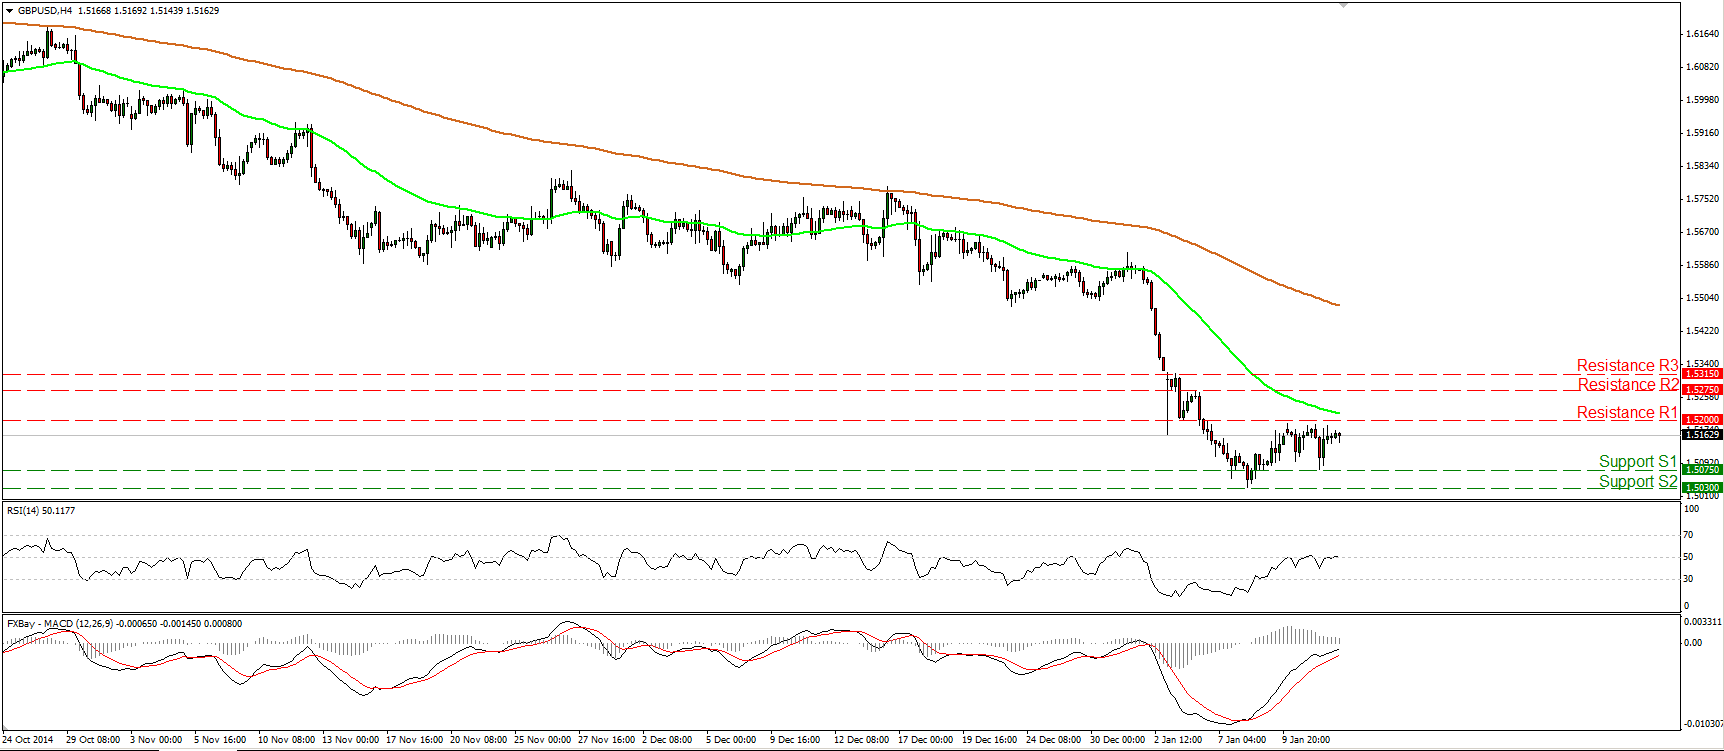
GBP/USD in a consolidative mode
GBP/USD fell following the decline in Britain’s CPI to its lowest rate since May 2000, but after hitting support at 1.5075 (S1), Cable rebounded to trade virtually unchanged. The pair has been oscillating between that level and the resistance of 1.5200 (R1) since Friday. The RSI oscillates around its 50 line confirming the recent consolidative mode, but the MACD is still in a rising mode approaching its zero line. However, even if we see a bounce, I would see it as a minor corrective move before the next leg down. In the bigger picture, as long as Cable is printing lower peaks and lower troughs below the 80-day exponential moving average, the overall outlook remains negative. Nevertheless, I would like to see a clear move below the psychological barrier of 1.5000 (S3) before getting more confident regarding the overall downtrend.
• Support: 1.5075 (S1), 1.5030 (S2), 1.5000 (S3)
• Resistance: 1.5200 (R1), 1.5275 (R2), 1.5315 (R3)
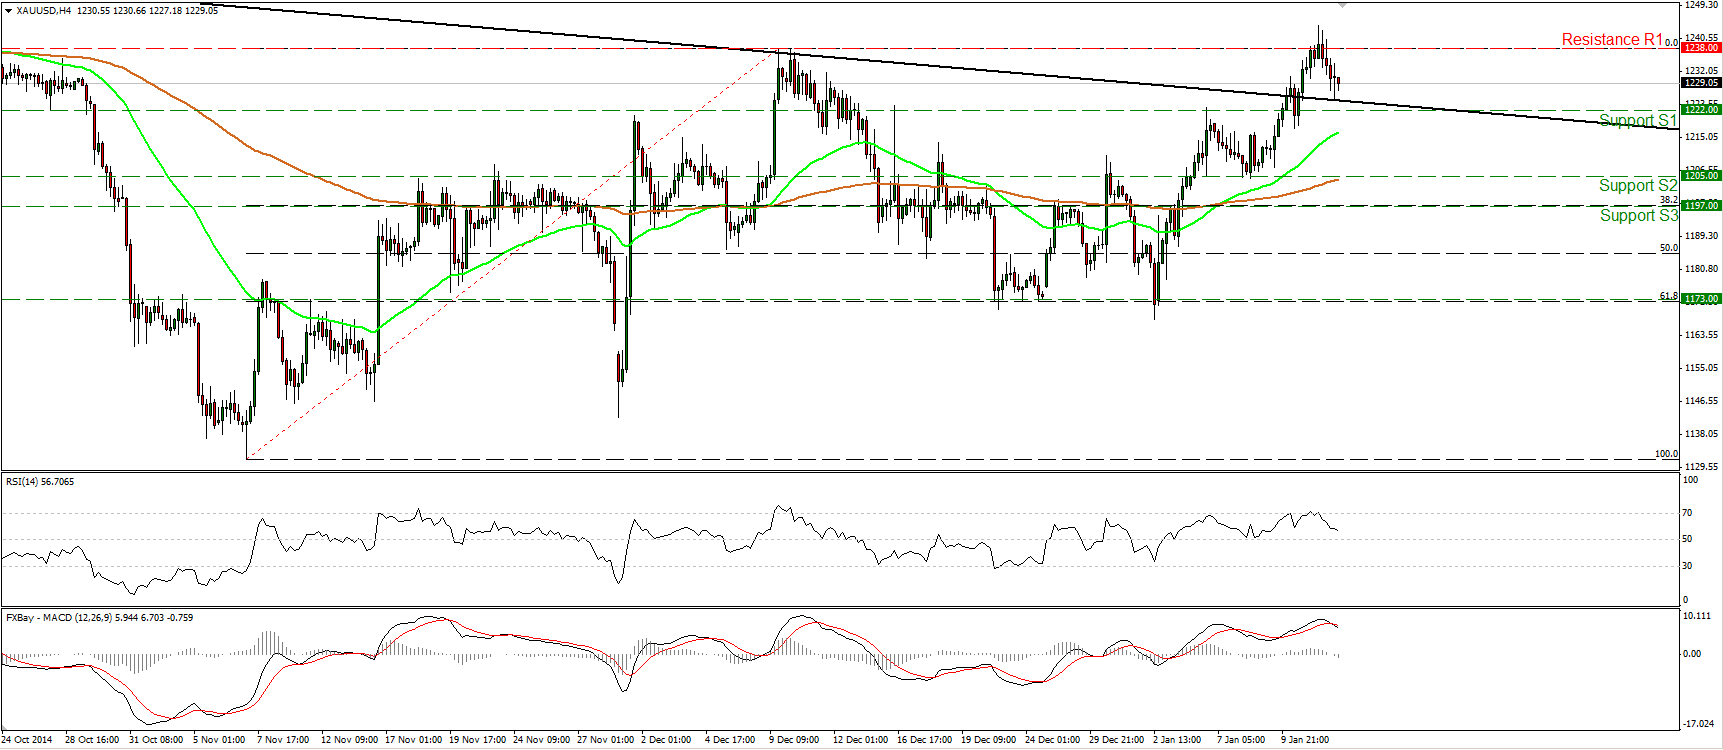
Gold back near the neckline
Gold moved slightly above the resistance line of 1238 (R1), marked by the highs of the 9th and 10th of December, but the longs were not strong enough to maintain the price above that level and subsequently the metal slid. During the early European morning, gold is trading near the neckline of a possible inverted head and shoulders pattern identified on the daily chart, slightly above the support area of 1222 (S1). Although I see signs that the pullback may continue a bit more, the possibility for a higher low still exists. Therefore, I would keep a cautiously positive stance. If and when the bulls manage to take the reins again, I would expect them to target again the 1238 (R1) resistance hurdle. I still believe that a decisive break above that area is likely to challenge the 1255 (R2) hurdle.
• Support: 1222 (S1), 1205 (S2), 1197 (S3)
• Resistance: 1238 (R1), 1255 (R2), 1270 (R3)
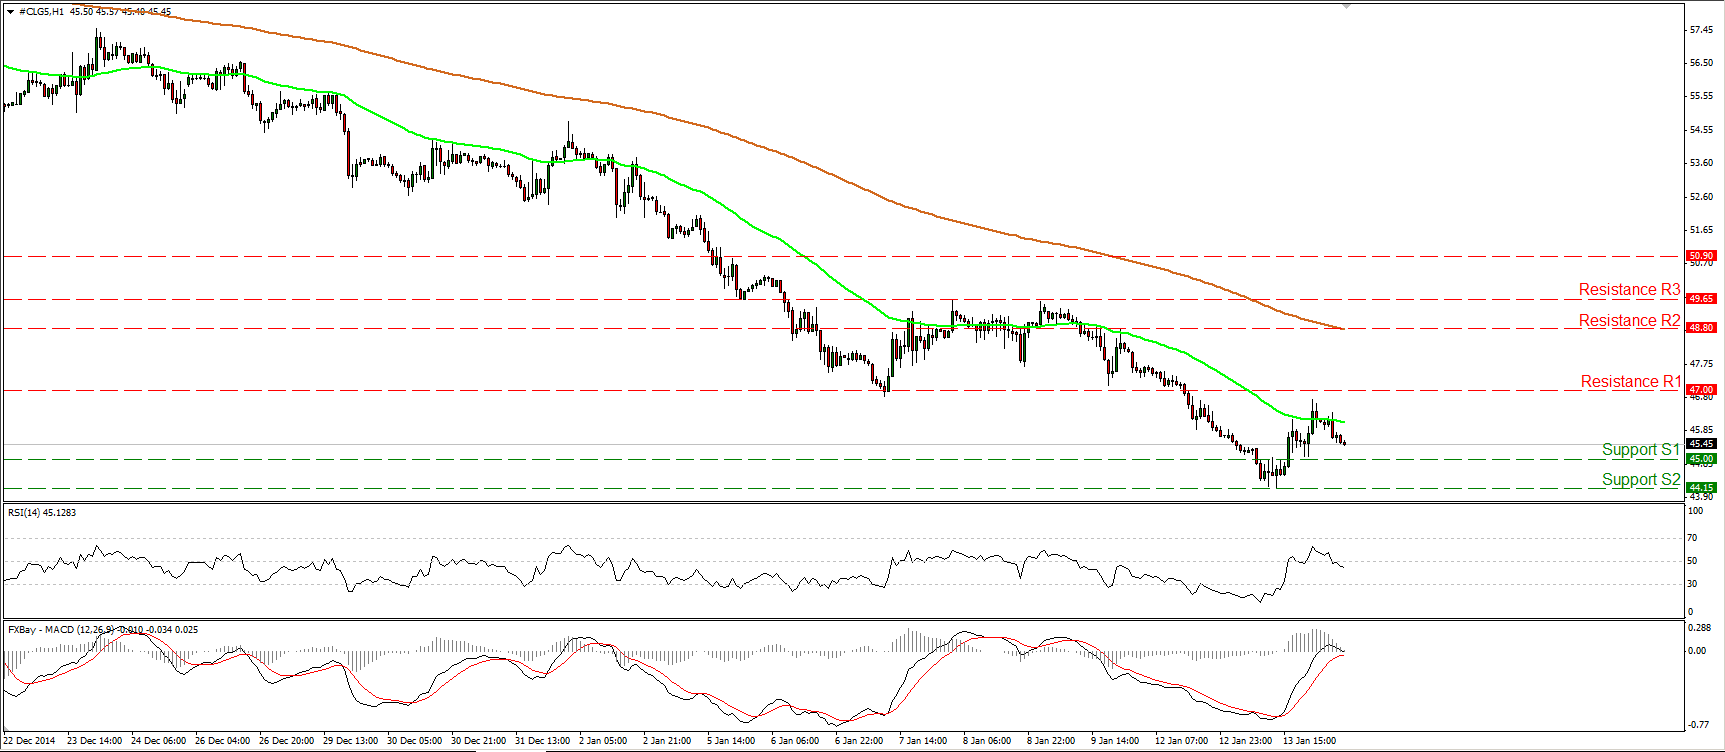
WTI dips below 45.00 but rebounds from slightly above 44.00
WTI continued its decline on Tuesday, falling below the 45.00 (S1) support line. However, the price triggered some buy orders near 44.15 (S2) and rebounded to hit resistance slightly below the 47.00 (R1) line. In my view, the rebound was just an upside corrective move and that the bears are ready to take control again. I would expect another move below 45.00 (S1) and another test of the 44.15 (S2) support. Our near-term momentum studies support the notion. The RSI did not hold above 50 and is back below it, pointing down, while the MACD topped marginally above its zero line, turned down and looks able to move below its trigger soon. On the daily chart, WTI is still printing lower peaks and lower troughs below both the 50- and the 200-day moving averages, which keeps the overall path to the downside.
• Support: 45.00 (S1), 44.15 (S2), 42.15 (S3)
• Resistance: 47.00 (R1), 48.80 (R2), 49.65 (R3)

