We now need to be patient for a considerable period
The FOMC meeting turned out as was widely expected: they dropped the “considerable period” phrase and instead said the Committee “can be patient in beginning to normalize the stance of monetary policy.” The statement was dovish in that they tried to smooth over the difference by saying that the new phrase was “consistent” with the old one – in which case, why change it? But Fed Chair Janet Yellen firmly tilted to the hawkish side by clarifying in her press conference that the new phrase meant they would not begin to raise rates “for at least the next couple of meetings,” which means not before April 2015. That’s earlier than expected previously. Moreover, she said specifically that rate hikes can occur at meetings when there is no press conference scheduled, which makes the timing even less predictable (there’s no press conference scheduled for next April, July or October). Clearly the volatility in the markets and the problems in Russia did not weigh on their thinking much – they remain focused on the domestic US economy and particularly the labor market, which is improving.
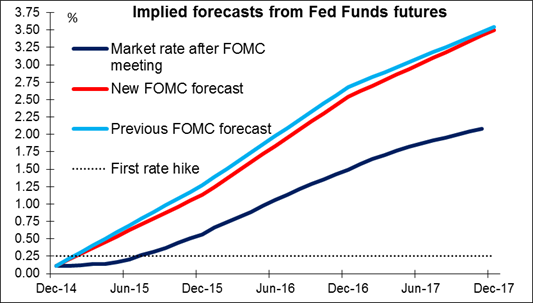
At the same time, the “dot plot” of forecasts by FOMC members did result in a lower average weighted forecast for the Fed funds rate at the end of 2015 and 2016, but only 14 bps lower or half a rate hike (and only 4 bps lower at end-2017). Also, the dispersion of views for 2015 and 2016 narrowed considerably, indicating that the Committee’s views are starting to coalesce, even though there were more dissenters this time (two hawks, one dove). As a result, the implied interest rates on Fed funds futures rose by 11 bps at the long end. The news corroborates our view that the dollar rally is likely to continue.
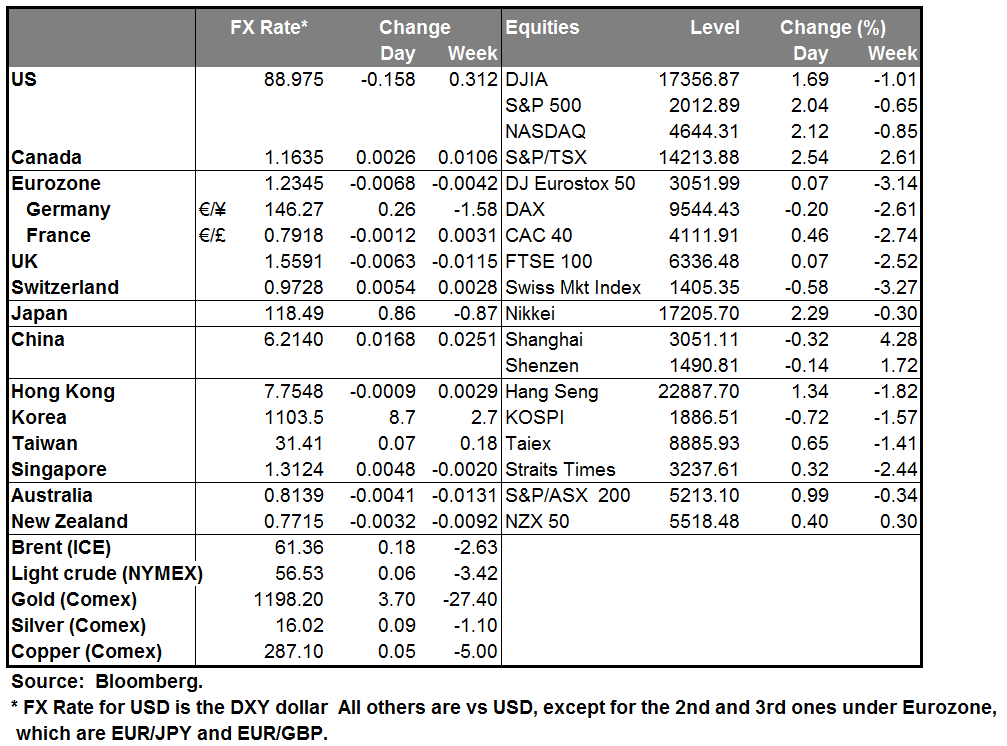
The market’s view was swift and unanimous: nearly everything with a dollar sign in front of it rose. The dollar strengthened, US equities had their best day of 2014, and credit spreads tightened. That’s quite an achievement for a more hawkish view. The good tone throughout markets may have had as much to do with what happened in oil and Russia as it did with the Fed, however.
Is the oil/ruble panic over? Oil prices rebounded yesterday, with Brent futures jumping as much as 5.8% in intra-day trading. It’s hard to say what caused the rebound: US crude oil supplies fell by far less than expected and indeed there was a large rise in inventories of WTI, but inventories of some fuels fell more than expected. It looks more like just a sudden change in sentiment and a short-covering rally, rather than any reaction to fundamental news.The Rub recovered too, gaining 16% against the dollar as the central bank intervened to support its currency and adjusted accounting rules to help banks cope. I wouldn’t say that the problems are over for either of these assets. In particular, the Russian economy faces long-term difficulties that will continue to weigh on the currency. However, it does appear that the one-way trade in both oil and RUB is over and there may be more volatility (up days as well as down days) from here. We could be in for further mean reversion for now.
The Greek parliament resoundingly rejected the government’s presidential candidate, who only received 160 votes. This was at the low end of expectations and is far below the 180 votes necessary to avoid a general election in January. The next vote, scheduled for next Tuesday, is meaningless as it’s almost sure to have the same result. The crucial vote will be the final one on Dec. 29th. If the government can’t find another 20 votes --- which seems difficult -- then the polls say the left-wing opposition party SYRIZA is likely to come into office with its policy of renegotiating the EU’s terms for bailing out Greece. At that point it becomes a case of the irresistible force meets the immovable object – will one budge, or will Greece leave the Eurozone? I expect that if it gets there, SYRZIA will back down to avoid being kicked out, but nothing in life is certain.
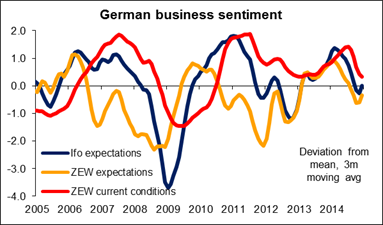
Today’s schedule: We have a relatively light calendar today. The main event during European time will be the German Ifo survey for December. All three indices are expected to have risen. Following the unexpected surge in the ZEW survey earlier this week, I believe that the Ifo survey could exceed the forecast as well. This could favor the continuation of the upside corrective phase of EUR/USD as it will indicate that the bloc’s growth engine is gaining momentum again.
In the UK, retail sales excluding gasoline are expected to have decelerated in November from the previous month.
In the US, we get the preliminary Markit service-sector and composite PMI for December and the Philadelphia Fed business activity index for the same month. Initial jobless claims for the week ended on Dec. 13 and the Conference Board leading index for November are also coming out.
The Market
EUR/USD plunged to 1.2320
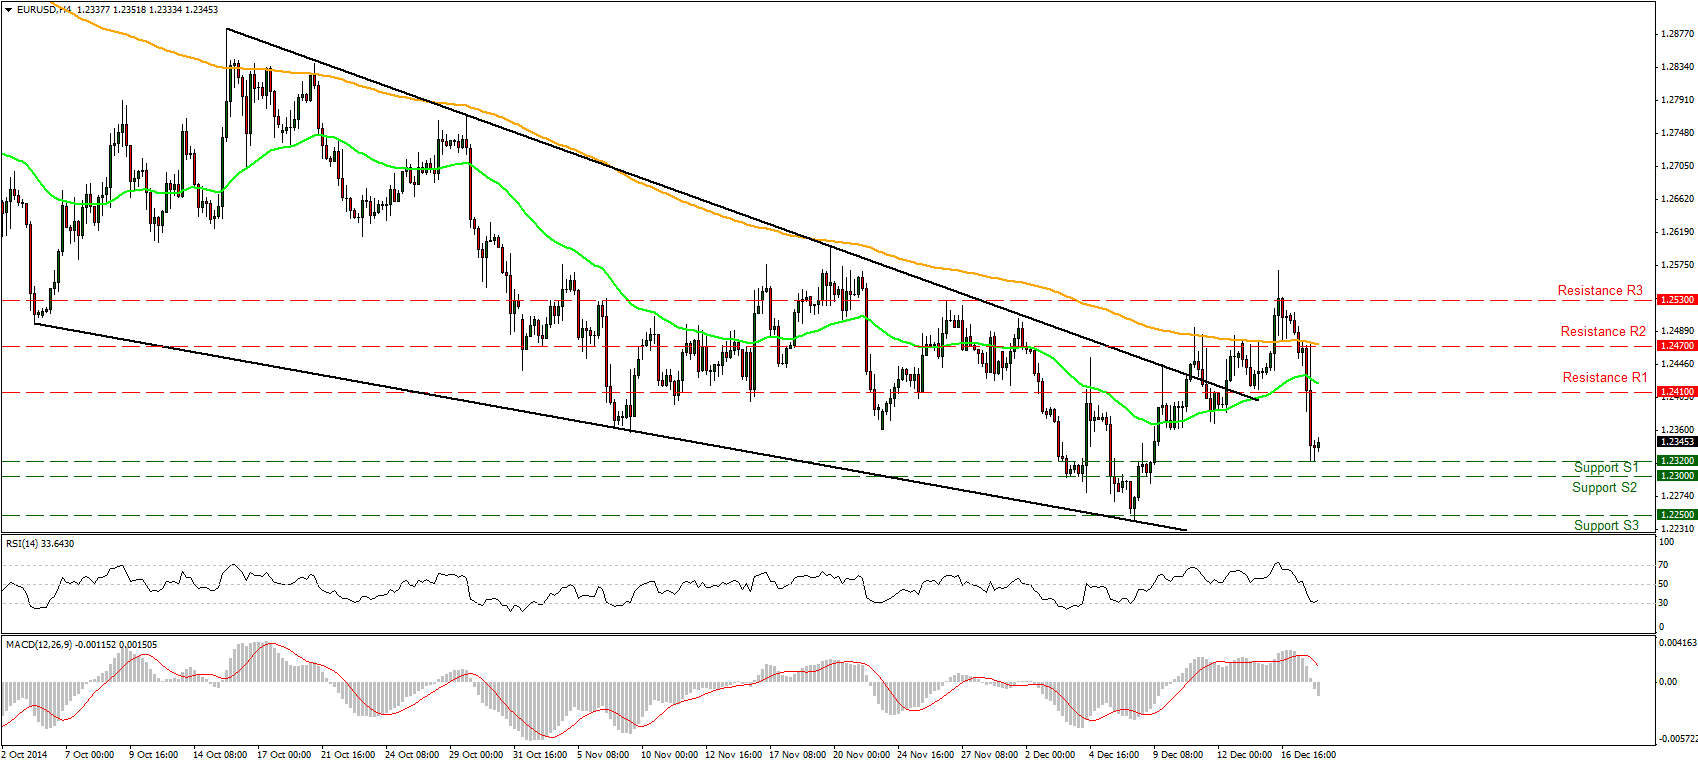
EUR/USD plunged on Wednesday after comments in the Wall Street Journal from ECB Executive Board member Benoit Coeure, who hinted that the ECB is poised to embark a large-scale asset purchases centered on government bonds. The move was halted by our support-turned-into-resistance level of 1.2410 (R1). The pair declined even more after the FOMC decision and Fed Chair Janet Yellen’s press conference. EUR/USD found support at 1.2320 (S1) where it gyrated during the early European hours Thursday. Looking at our short-term momentum studies, the RSI found support at its 30 level and is pointing up, while the MACD fell into negative territory but shows signs of bottoming and is willing to turn around. These signals suggest that we may see small upward movement before the bears prevail again. On the daily chart, the rate is still printing lower lows and lower highs below both the 50- and the 200-day moving averages and this keeps the overall path to the downside.
• Support: 1.2320 (S1), 1.2300 (S2), 1.2250 (S3)
• Resistance: 1.2410 (R1), 1.2450 (R2), 1.2470 (R3)
USD/JPY above 117.35 again
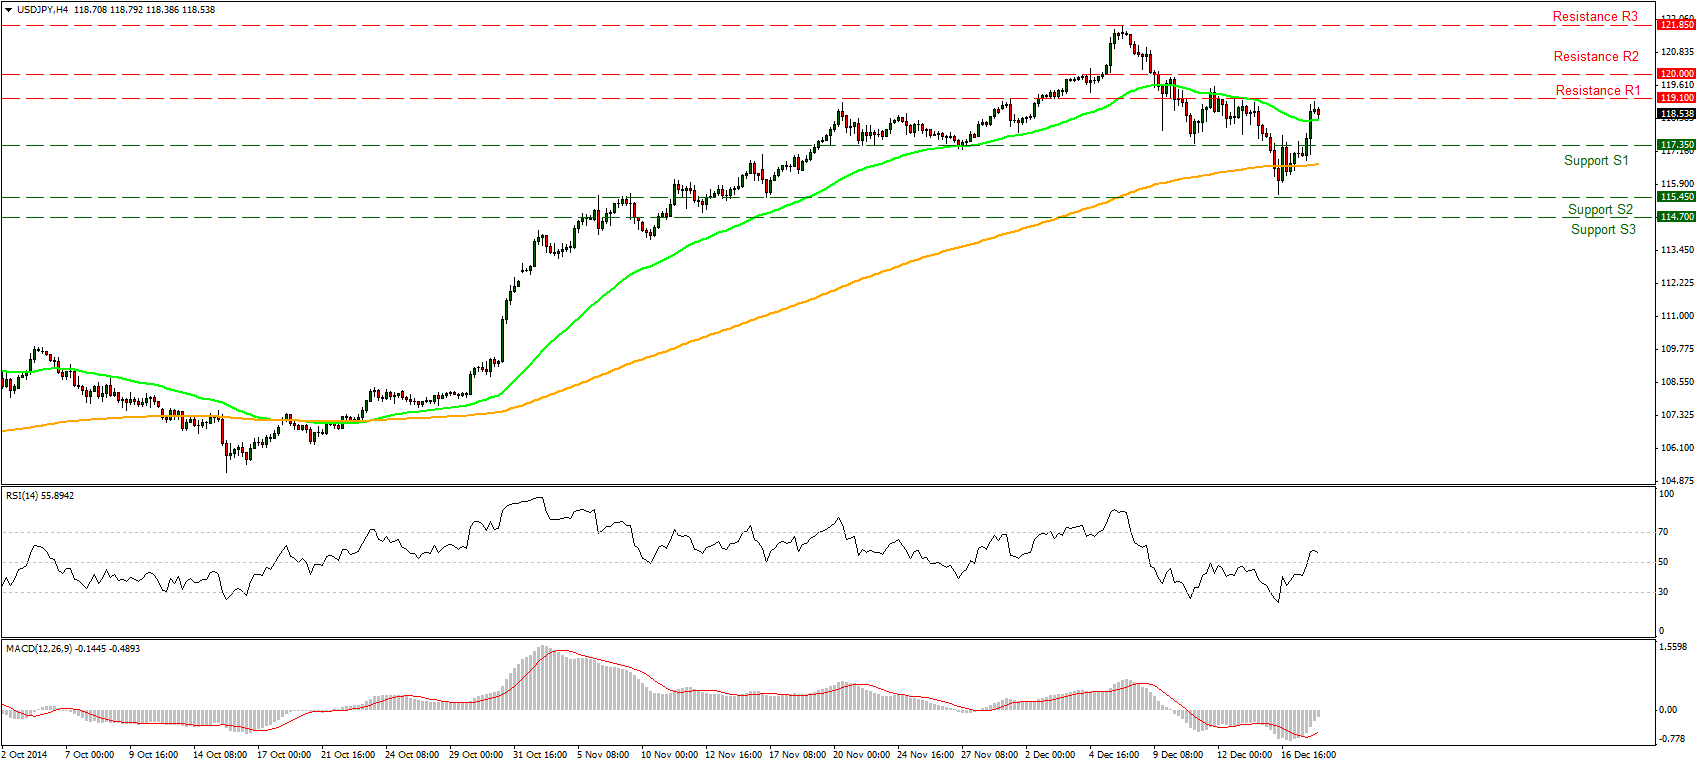
USD/JPY firmed up on Wednesday and broke above the resistance-turned-into-support hurdle of 117.35 (S1). The move was stopped a few pips below the 119.10 (R1) resistance line and is testing that level during the early European hours. Looking at our short-term momentum signals, the RSI found resistance just above the 50 line and moved lower, while the MACD bottomed, crossed above its trigger line and is moving towards its positive territory. The mixed momentum signs point to a halt in the advance, at least temporarily, and I would wait for a break above 120.00 (R2) to get confident for further advances. As for the broader trend, the price structure is still higher highs and higher lows above both the 50- and the 200-day moving averages and this keeps the overall path of the pair to the upside.
• Support: 117.35 (S1), 115.45 (S2), 114.700 (S3)
• Resistance: 119.10 (R1), 120.00 (R2), 121.85 (R3)
GBP/USD lower on heightened risk on growth and inflation
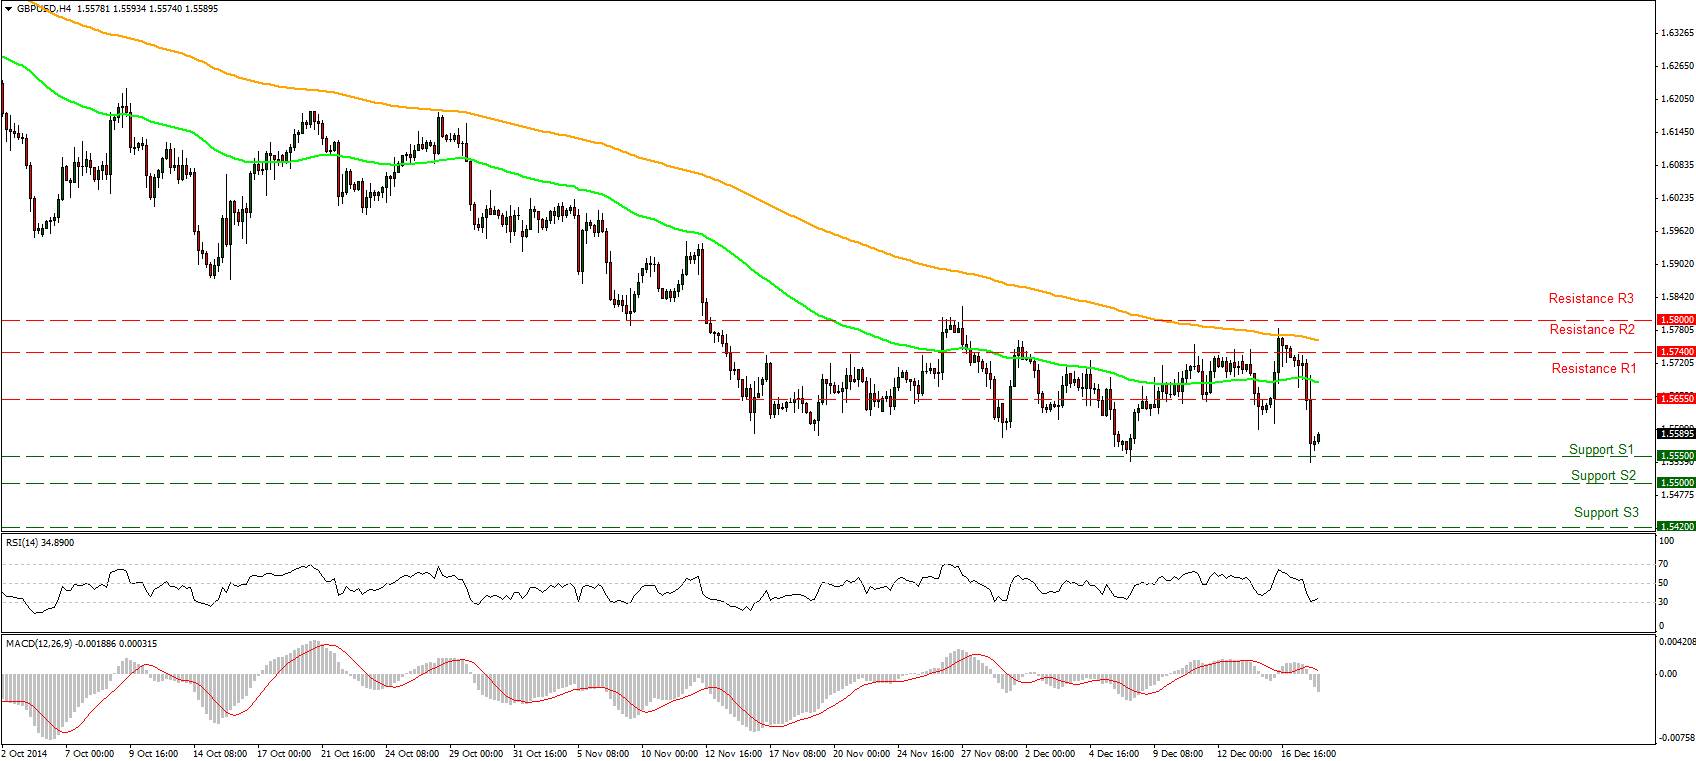
GBP/USD declined sharply on Wednesday despite the strong labor data. The plunge came after the BoE minutes of its early December policy meeting revealed that the majority of MPC members saw heightened risk that growth may soften more than expected or that inflation may stay below target for longer than expected. The rate declined further following the FOMC meeting but the move was halted by the 1.5550 (S1) support area. With no clear trending direction on the 4-hour chart, I would adopt a neutral stance as far as the short-term picture is concerned. GBP/USD is in a consolidative mode since early November, although the price is more likely to trend down than up. As for the broader trend, I still believe that as long as Cable is trading below the 80-day exponential moving average, the overall path remains negative.
• Support: 1.5550 (S1), 1.5500 (S2), 1.5420 (S3)
• Resistance: 1.5655 (R1), 1.5740 (R2), 1.5800 (R3)
WTI finds buy orders near 54.80
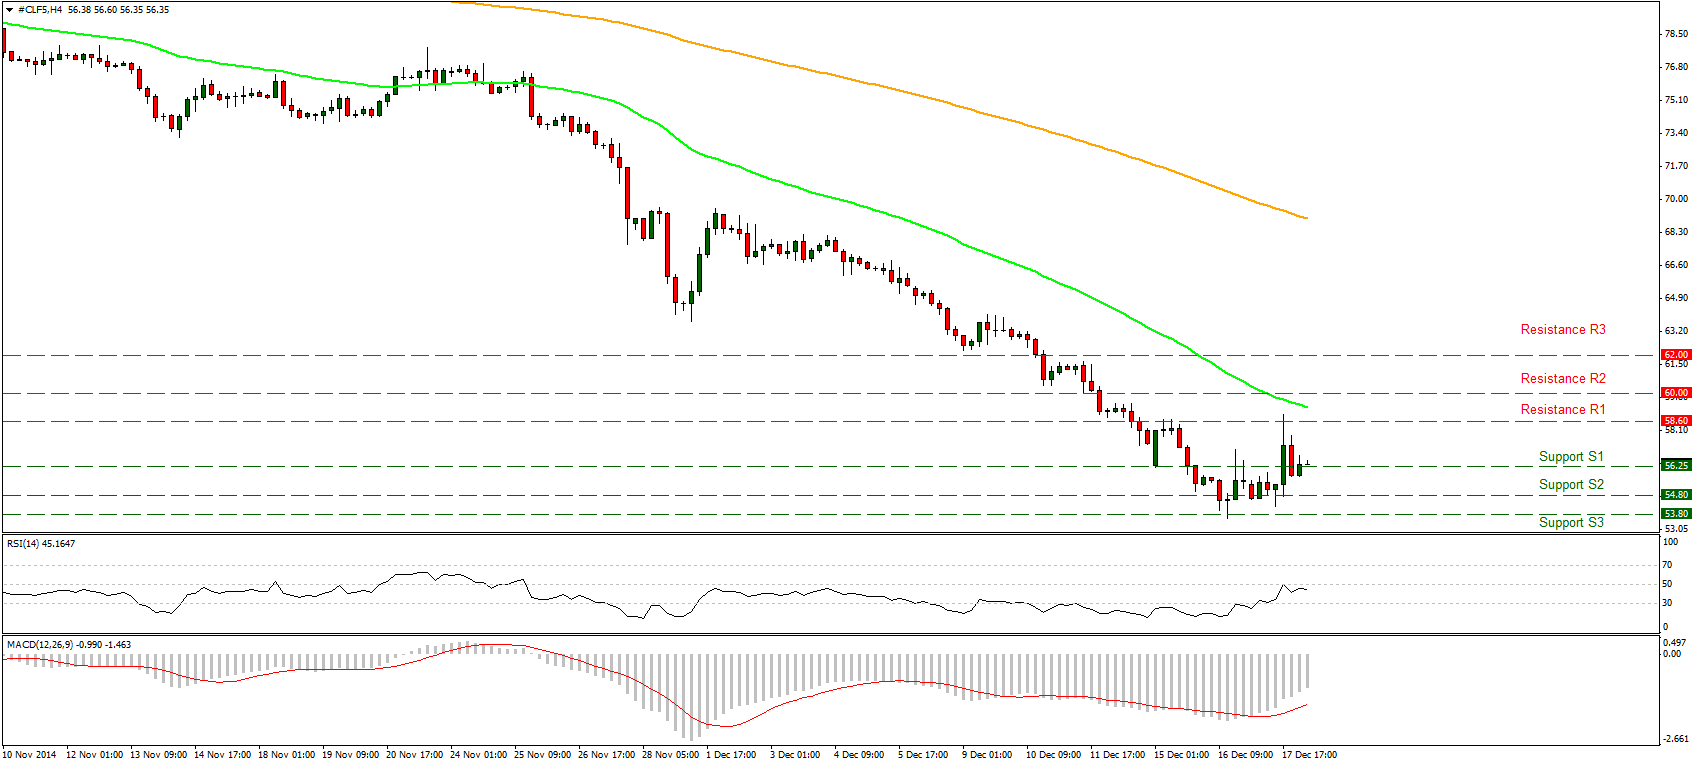
WTI jumped on Wednesday after finding some buy orders near the 54.80 (S2) level but the advance was limited to a few cents above our resistance-turned-into-support line of 56.25 (S1). In the bigger picture the overall path remains to the downside and our daily technical studies support this notion. However, we may see some further advances before the sellers prevail again. Both the 50- and the 200-day moving averages remain above the price structure and their slope stays to the downside. The 14-day RSI stays within its oversold territory pointing up, while the daily MACD, although at extreme low levels, seems willing to cross its trigger line. These momentum signs designate strong downside momentum and reinforce the case that we are likely to see lower oil prices in the near future. Yet, as I said before, we could see a small corrective wave upwards.
• Support: 56.25 (S1). 54.80 (S2), 53.80 (S3)
• Resistance: 58.60 (R1), 60.00 (R2), 62.00 (R3)
Gold remains above 1190
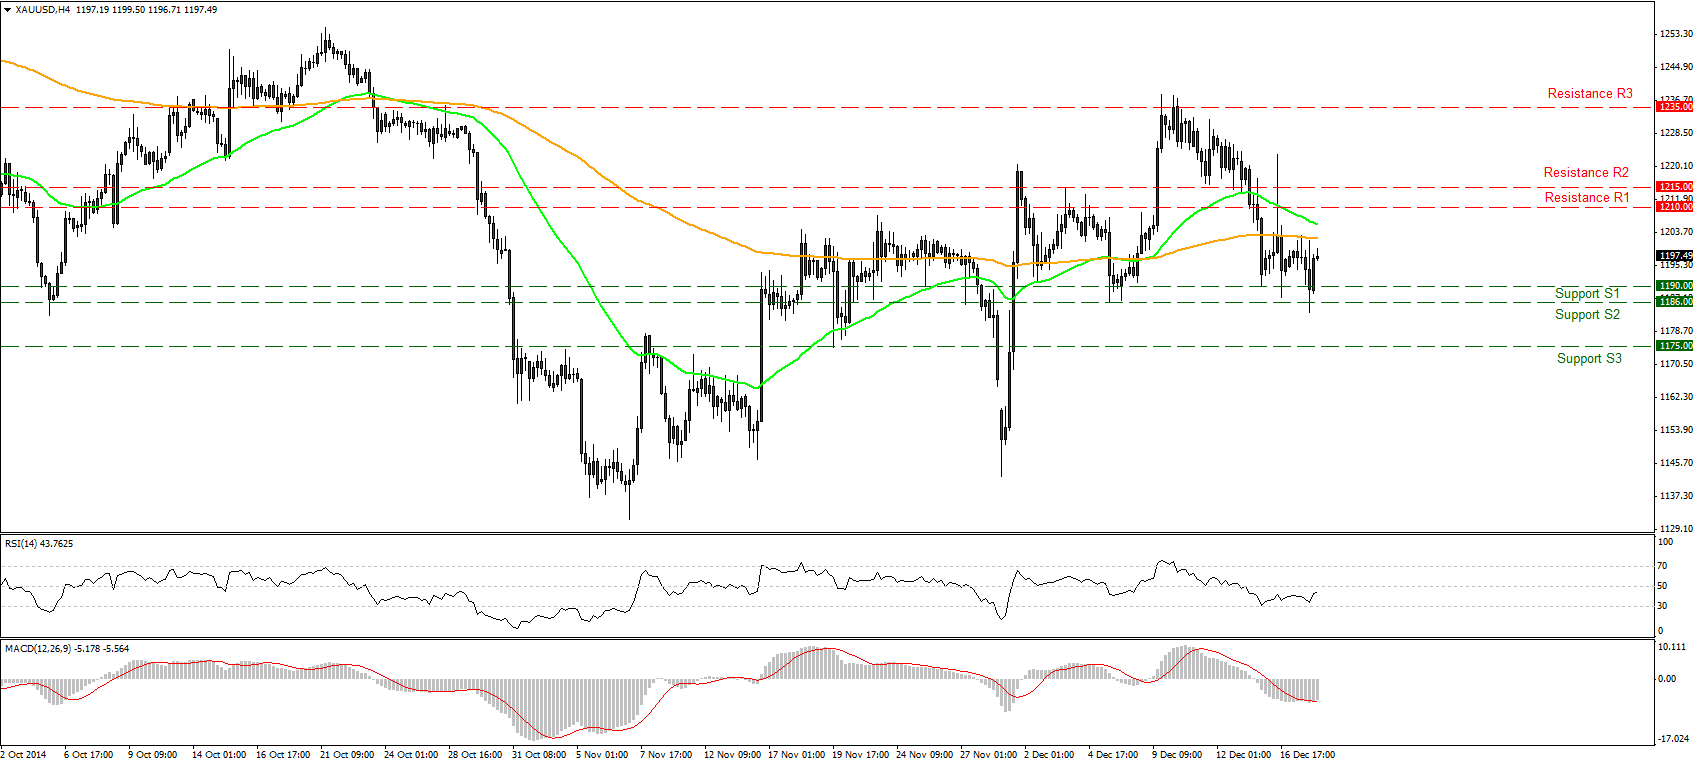
Gold dipped briefly on Wednesday and bounced back up after finding support just below the 1186 (S2) area. The price remains capped below the 200-period moving average and I would expect a break above that hurdle for another test of the 1210 (R1) resistance line. Looking at our short-term momentum signals, the RSI found support again at its 30 line and moved up, while the MACD, although in its negative territory, poked its nose above its trigger line. This is likely to show that the sellers seem unable to push the price lower, thus another test of the 1210 (R1) resistance hurdle seems possible.
• Support: 1190 (S1), 1186 (S2), 1175 (S3)
• Resistance: 1210 (R1), 1215 (R2), 1235 (R3)

